



The debt & deficits conversation in America is currently dominated by two camps. The first is comprised of welfare-state advocates and those making MMT-adjacent claims, basically insisting it doesn’t matter — “the deficit is just a number” or “we owe it to ourselves” or “but look at Japan!”. The second camp is those who treat it as an imminent apocalypse and have been insisting, for years, that the dollar will collapse any day now — the Ray Dalios and Peter Schiffs who would like to sell books or ads for gold. Both camps are equally unserious.
The reality, in our view, is more nuanced than either camp allows: that is, a slow-moving structural crisis buffered by unique advantages that are powerful but not permanent. What follows, then, are our 14 ground truths on US debt & deficits — these aren’t prognostications per se, nor policy prescriptions. Think of them instead as first principles in the Aristotelian sense: foundational truths, grounded in evidence and analysis, that cannot be deduced from any other proposition, and from which our eventual ideas and solutions are likely to be derived.
Part I: Fiscal Reality Check
1) America now spends more servicing its debt than defending itself.
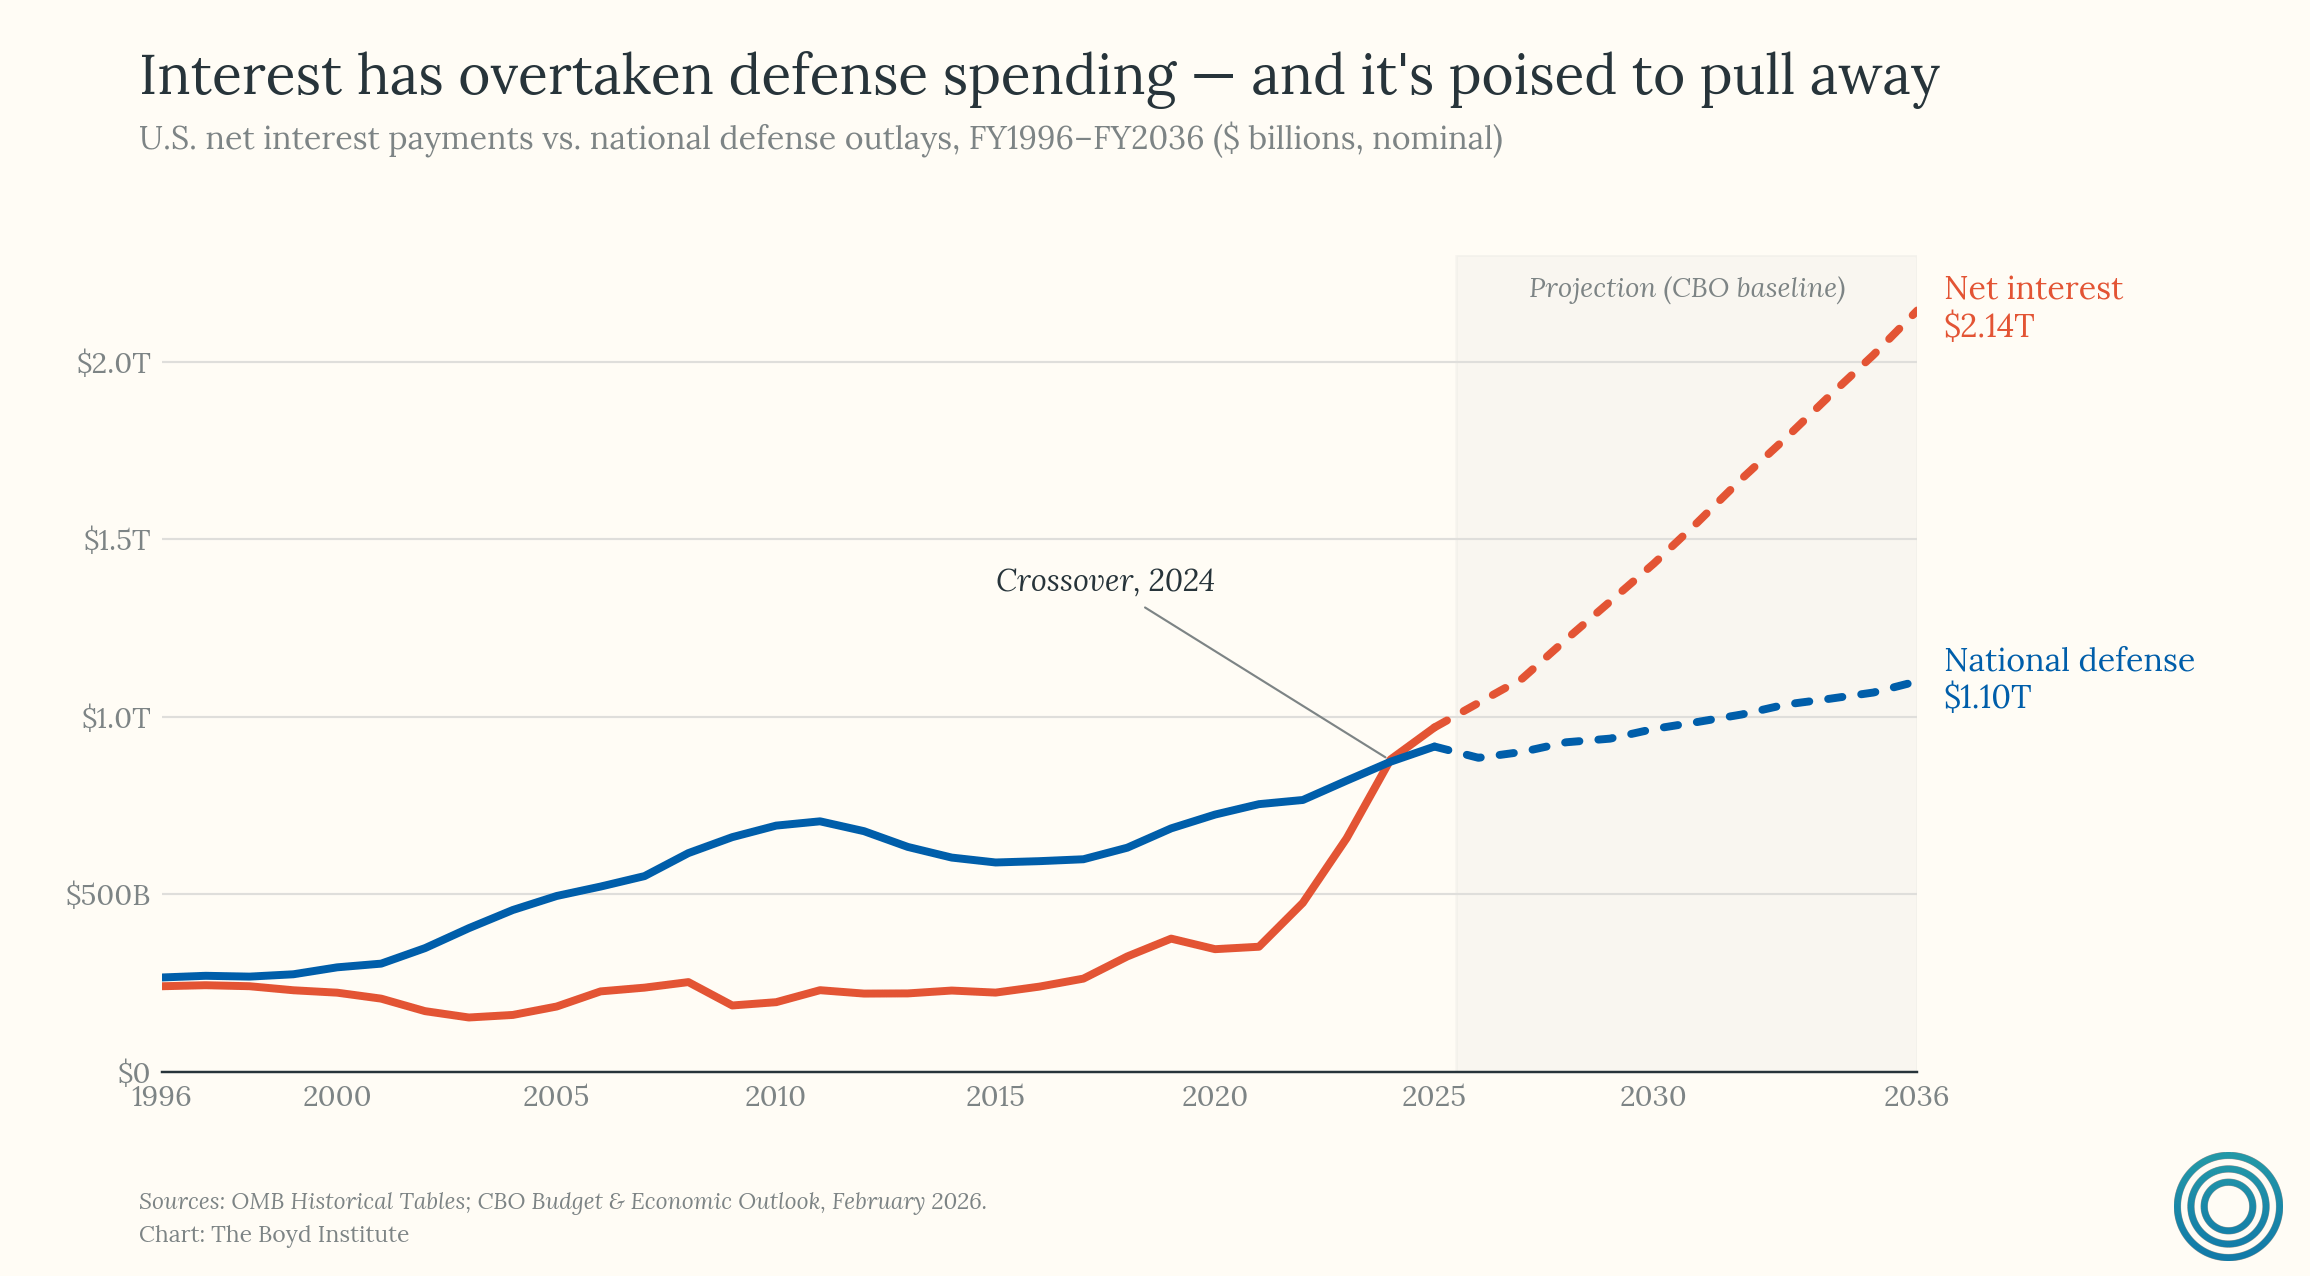
For the full fiscal year 2026, net interest payments on the national debt are set to reach around $1 trillion. This amount is more than two and a half times the pre-pandemic level of $375 billion in FY2019. The federal government is now paying about $88 billion each month just in interest. This makes it the second-largest item in the federal budget, behind only Social Security. The CBO projects a total of $13.8 trillion in interest payments from 2026 to 2035. To put this in perspective, that’s about one out of every five tax dollars collected during that time spent purely on paying off past borrowing.
Historian Niall Ferguson postulates that when a great power’s debt payments exceed its military spending — a point the United States reached in 2024 — it marks a crucial turning point. At this stage, an empire starts consuming resources that sustain it. This pattern reflects a consistent historical trend: the Habsburg monarchy, Bourbon France, the Ottoman Empire, and the British Empire all faced declines after crossing this threshold. The United States has now joined this group, and the divide is expected to grow.
One important caveat deserves acknowledgment. Each of those historical cases operated under hard monetary constraints, gold or silver standards that made debt monetization impossible. The United States, as the issuer of a fiat reserve currency, does not face such limits. It can, theoretically, print money to meet its obligations in ways that no Habsburg treasurer or Ottoman official could. However, this does not solve the underlying structural issue. The crowding-out effect — where debt servicing takes funds away from investment in defense — occurs regardless of a government’s ability to monetize its debt.
The question is not whether the US can service its obligations, but what it must sacrifice, or debase, to do so. The feedback loop that makes this particularly dangerous, specifically America’s dependence on dollar dominance to sustain the very borrowing that now burdens it, will be examined in the sections that follow.
2) Absent a productivity boom, every fiscal exit path is perilous.
The fiscal arithmetic offers only a handful of exits, and none are painless except one.
The first is inflating the debt away by eroding its real value through currency debasement. This is effectively a tax on savers and anyone living on a fixed income. It destroys institutional credibility and, as we will see in our discussion of dollar dominance, is particularly self-defeating for the United States.
The second is austerity: cutting spending or raising taxes to close the gap. This is politically toxic in any democracy and, given the particular political economy dynamics described later in this piece, functionally impossible in the United States.
The third is financial repression: artificially holding interest rates below inflation in order to gradually transfer wealth from creditors to the government. Several countries attempted versions of this strategy in the postwar decades, and the track record is grim. France and Italy ran negative real interest rates throughout much of the 1950s and 1960s, channeling cheap credit to state enterprises while quietly confiscating the purchasing power of private savers. The result was chronic balance-of-payments crises and repeated IMF interventions. Brazil’s experience was even more acute. When the military government attempted to hold nominal rates below galloping inflation in the late 1970s, capital flight was swift and severe. By 1982, the country was effectively shut out of international credit markets. The details differed, but the sequence was largely the same: capital flight, distorted investment, and the destruction of the institutional confidence the strategy depends on.
The fourth — and the only option that does not require imposing visible costs on clearly identifiable groups — is to grow out of the debt by generating enough real GDP growth to outrun the pace of debt accumulation. But this option has a hard constraint that is often obscured in political rhetoric: long-run economic growth comes from only two sources — a larger workforce or higher output per worker.
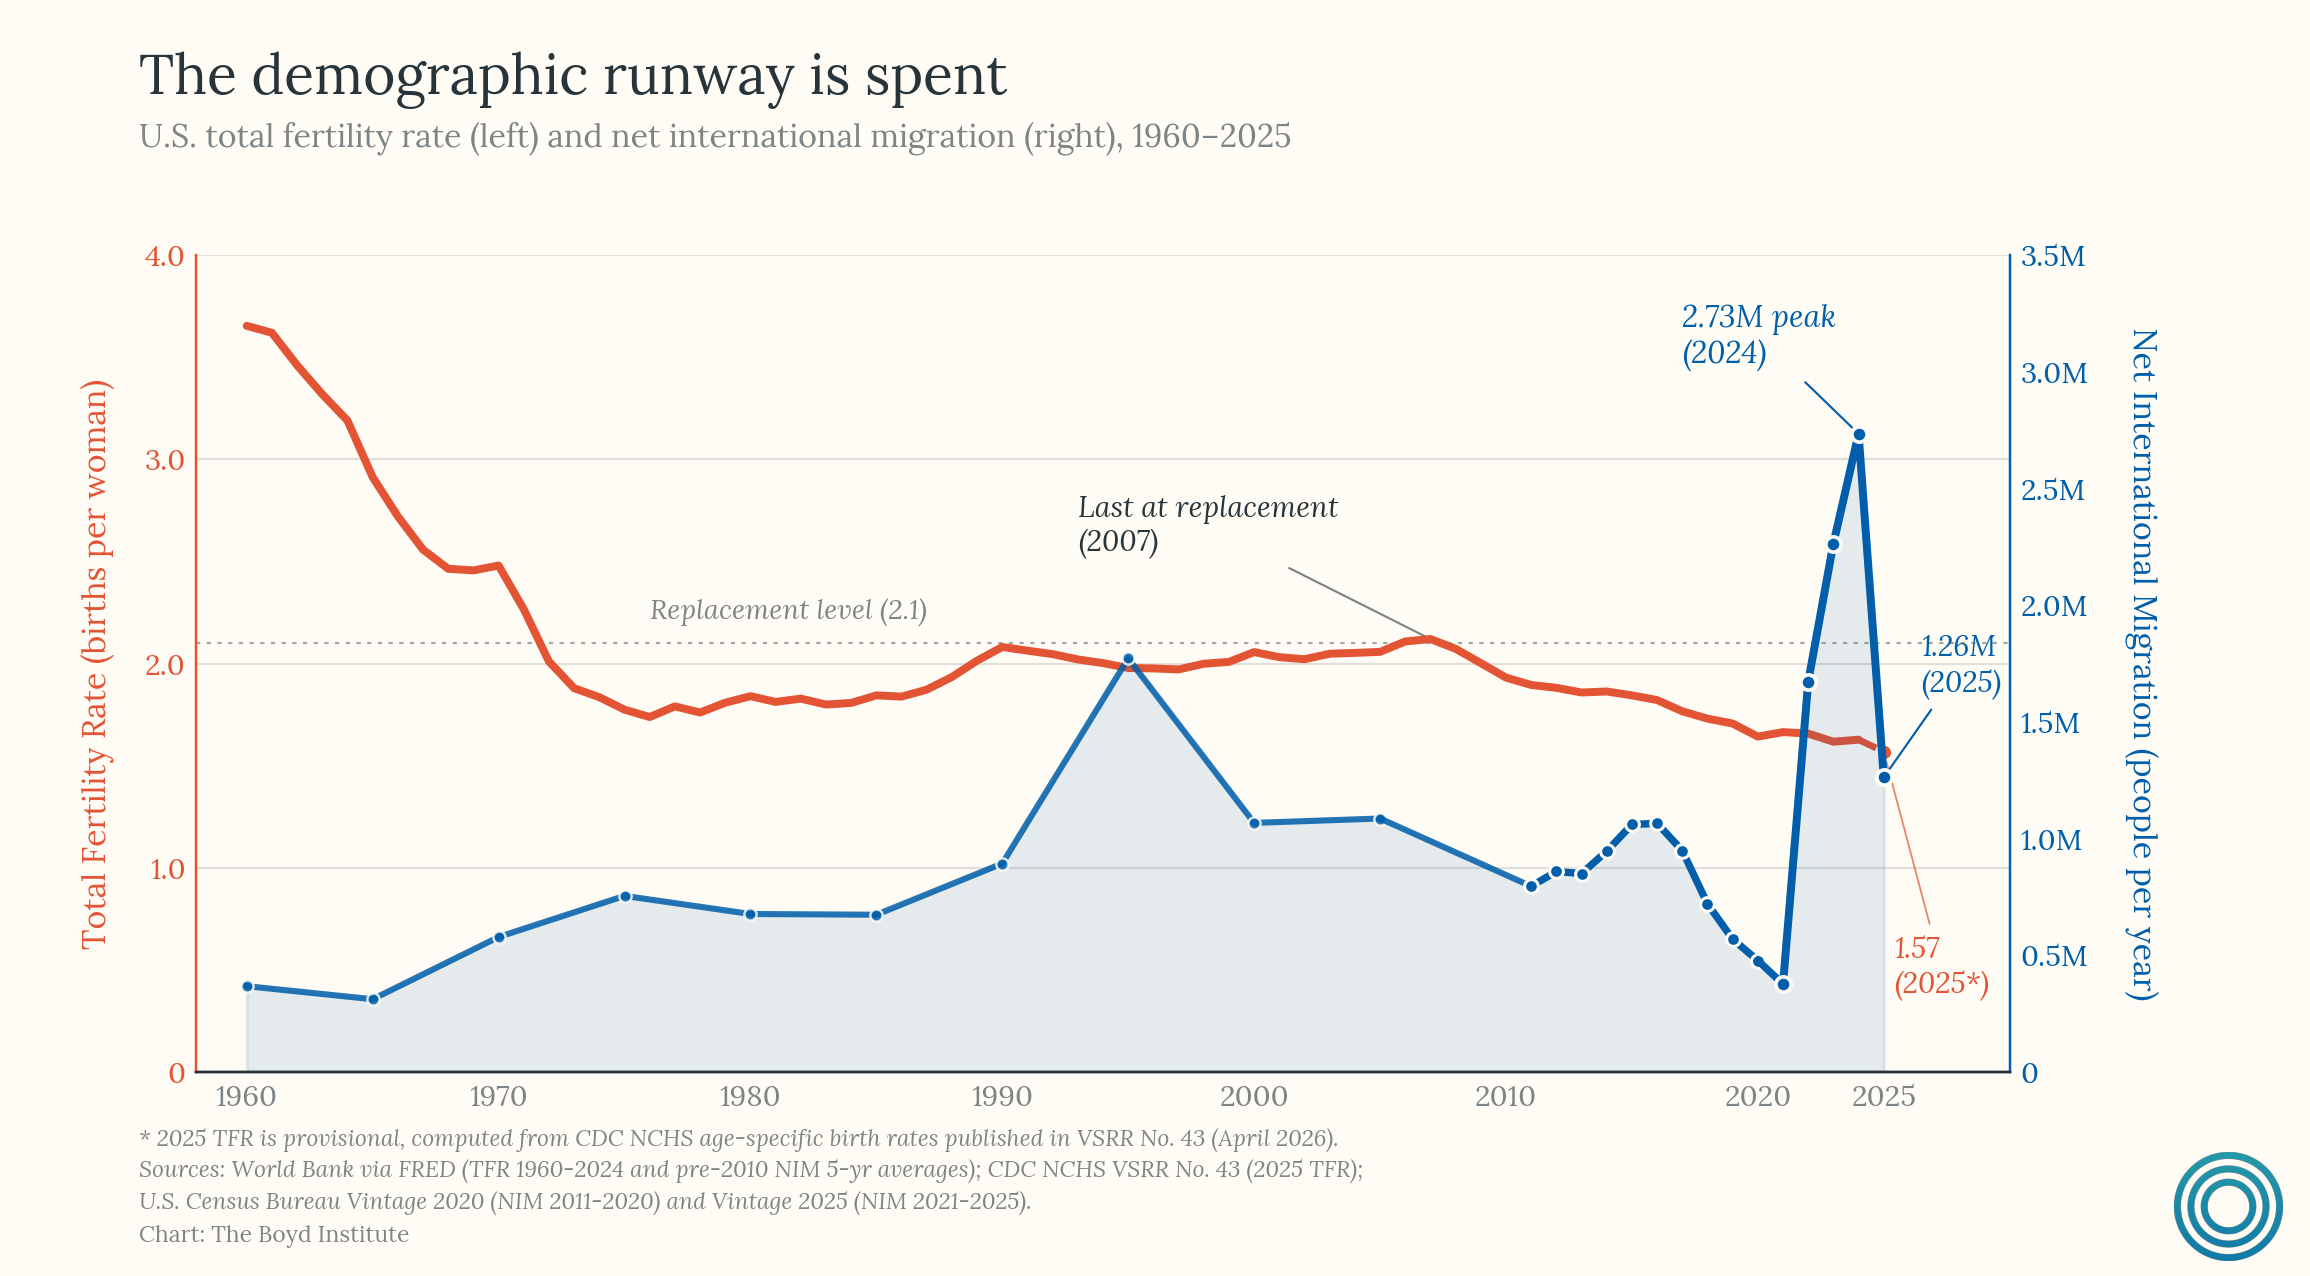
Immigration, historically America’s most powerful mechanism for demographic replenishment, has collapsed and appears likely to remain heavily restricted for at least the next several years (pending a new pro-immigration referendum of sorts in the upcoming election cycle(s)). Furthermore, organic population growth offers little relief. US fertility has remained below replacement level for decades and has recently fallen even further. The demographic tailwinds that powered postwar American growth are gone.
So, that leaves us with one realistic “grow our way out” path: a productivity boom. The most plausible catalyst for such a path is AI-driven productivity growth fueled by continued hyperscaler investment. Under optimal conditions — a pro-data center construction policy environment allowing for massive and sustained capital expenditure on AI infrastructure, sufficient power generation, limited regulatory obstruction, and continued Wall Street enthusiasm (all eyes on the OpenAI IPO) — it is conceivable.
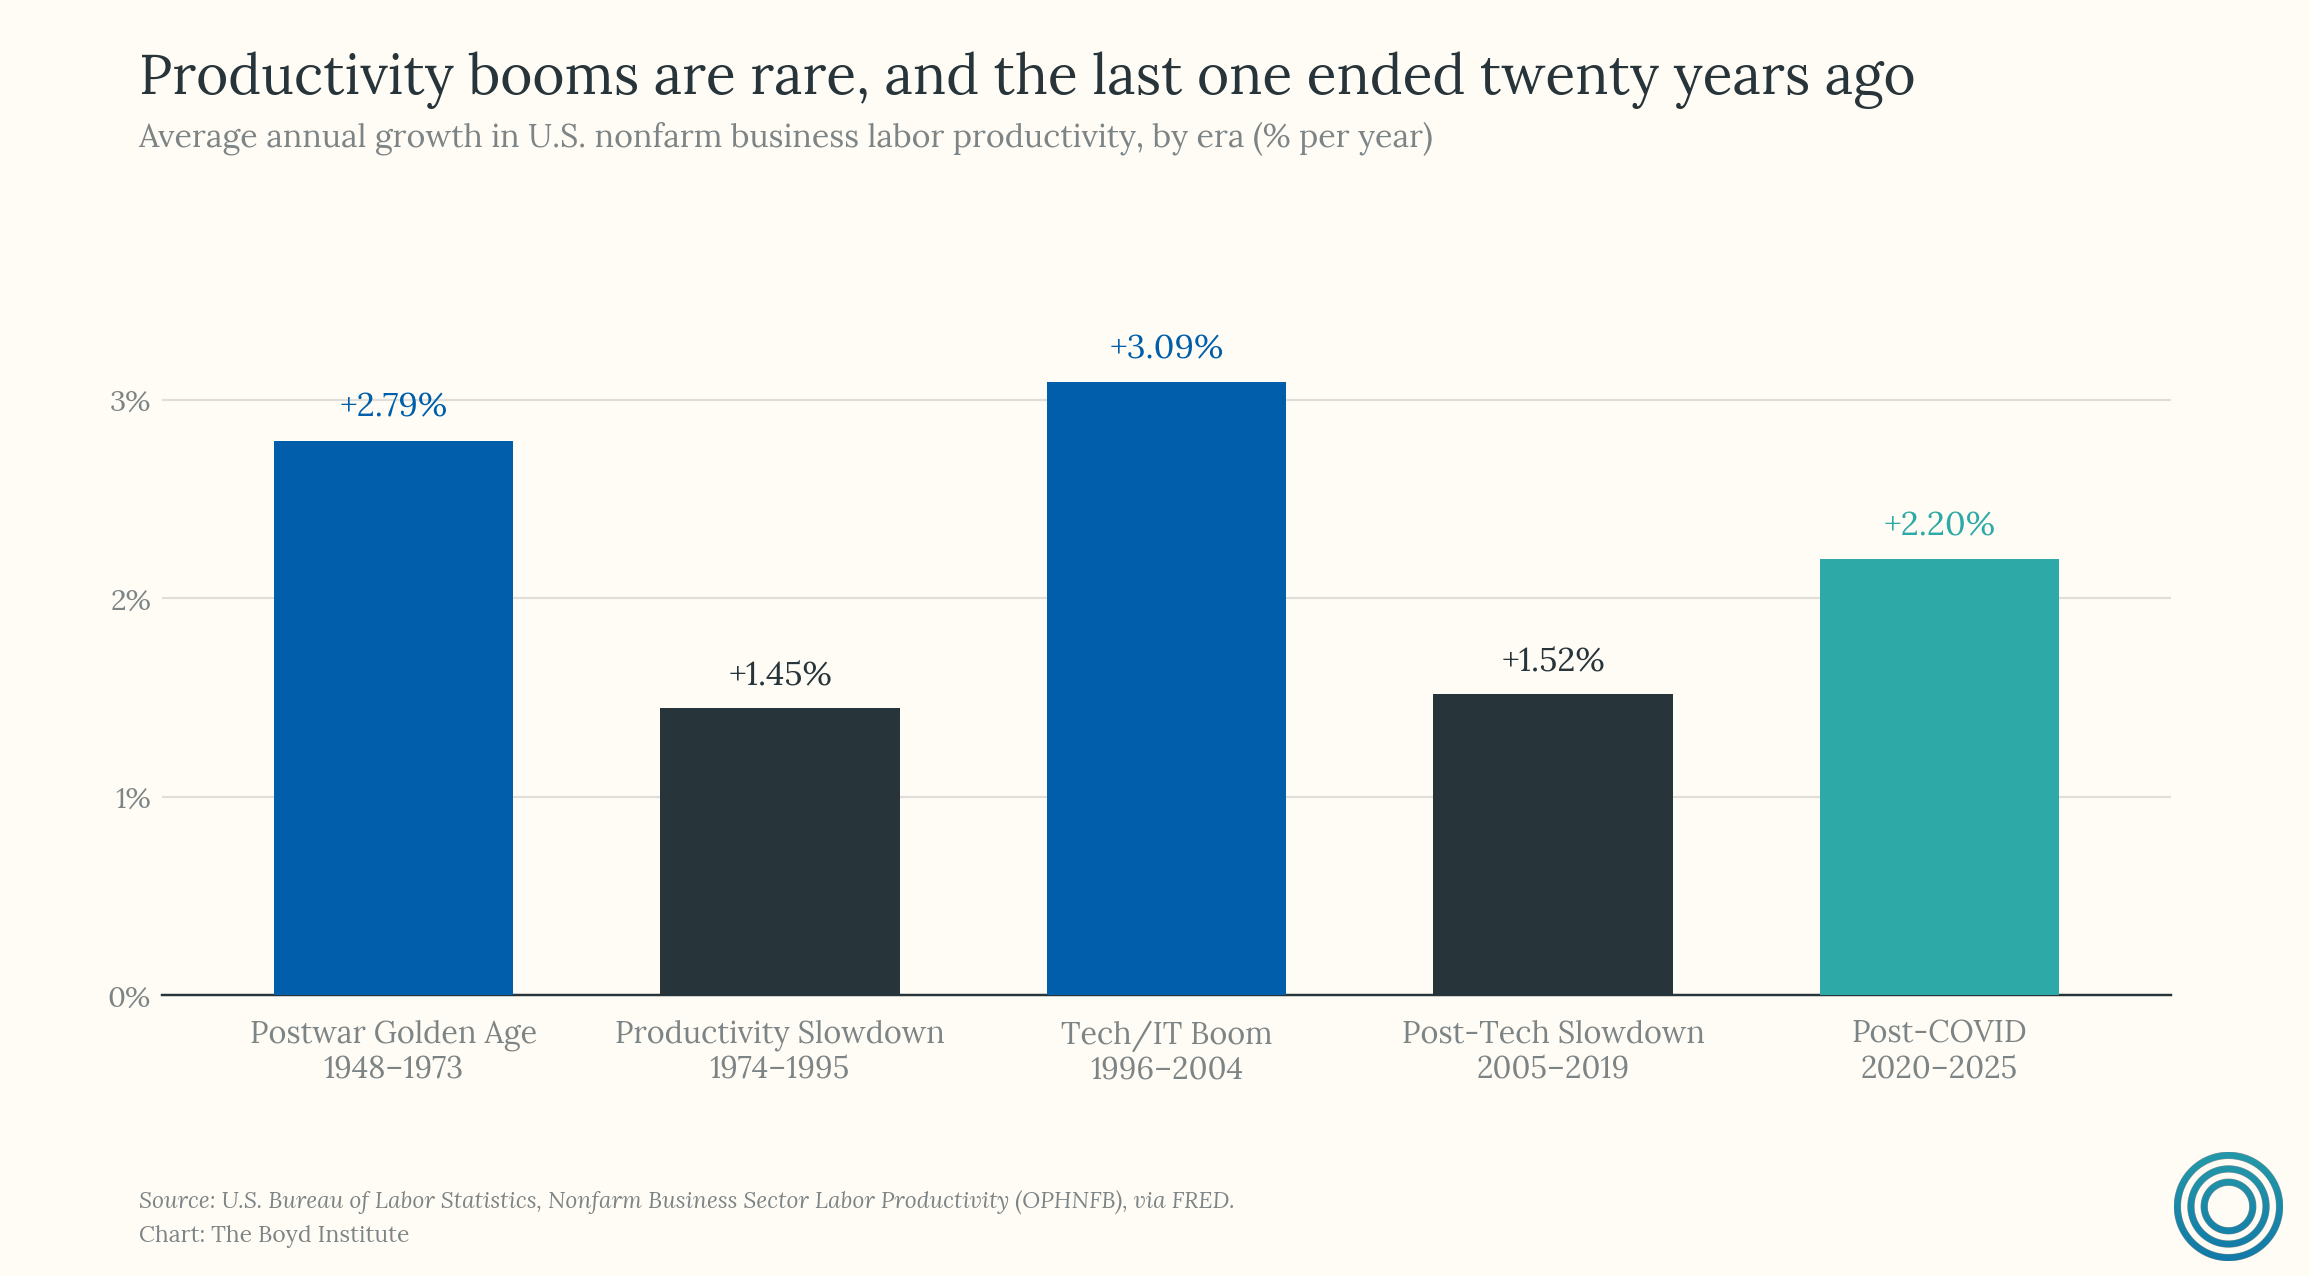
But there is an important historical caveat. Transformative technologies routinely take far longer to genuinely yield productivity gains than early enthusiasm suggests. The computer revolution began reshaping business in the 1960s and consumer life in the 1980s; yet economist Robert Solow famously quipped in 1987 that “you can see the computer age everywhere but in the productivity statistics.” Indeed, the major productivity gains from computing did not materialize until the second half of the 1990s.
Another example — electricity — became commercially widespread in the 1890s but did not produce broad productivity acceleration until the 1920s. As for AI, the open question is how long the productivity lag will be.
3) Not all debt is equal, and America increasingly borrows to consume rather than to build.
The composition of federal spending has undergone a dramatic transformation over the past half-century. Between 1962 and 2017, federal investment fell by 59% as a share of total spending — R&D spending alone declined from 9.2% to 2.9% of the federal budget.
In that same period, government transfers — Social Security, Medicare, Medicaid, and related programs that write checks directly to individuals — rose by 162% as a share of total spending. By 2025, transfers accounted for 69% of all federal outlays, up from just 28% in 1962.
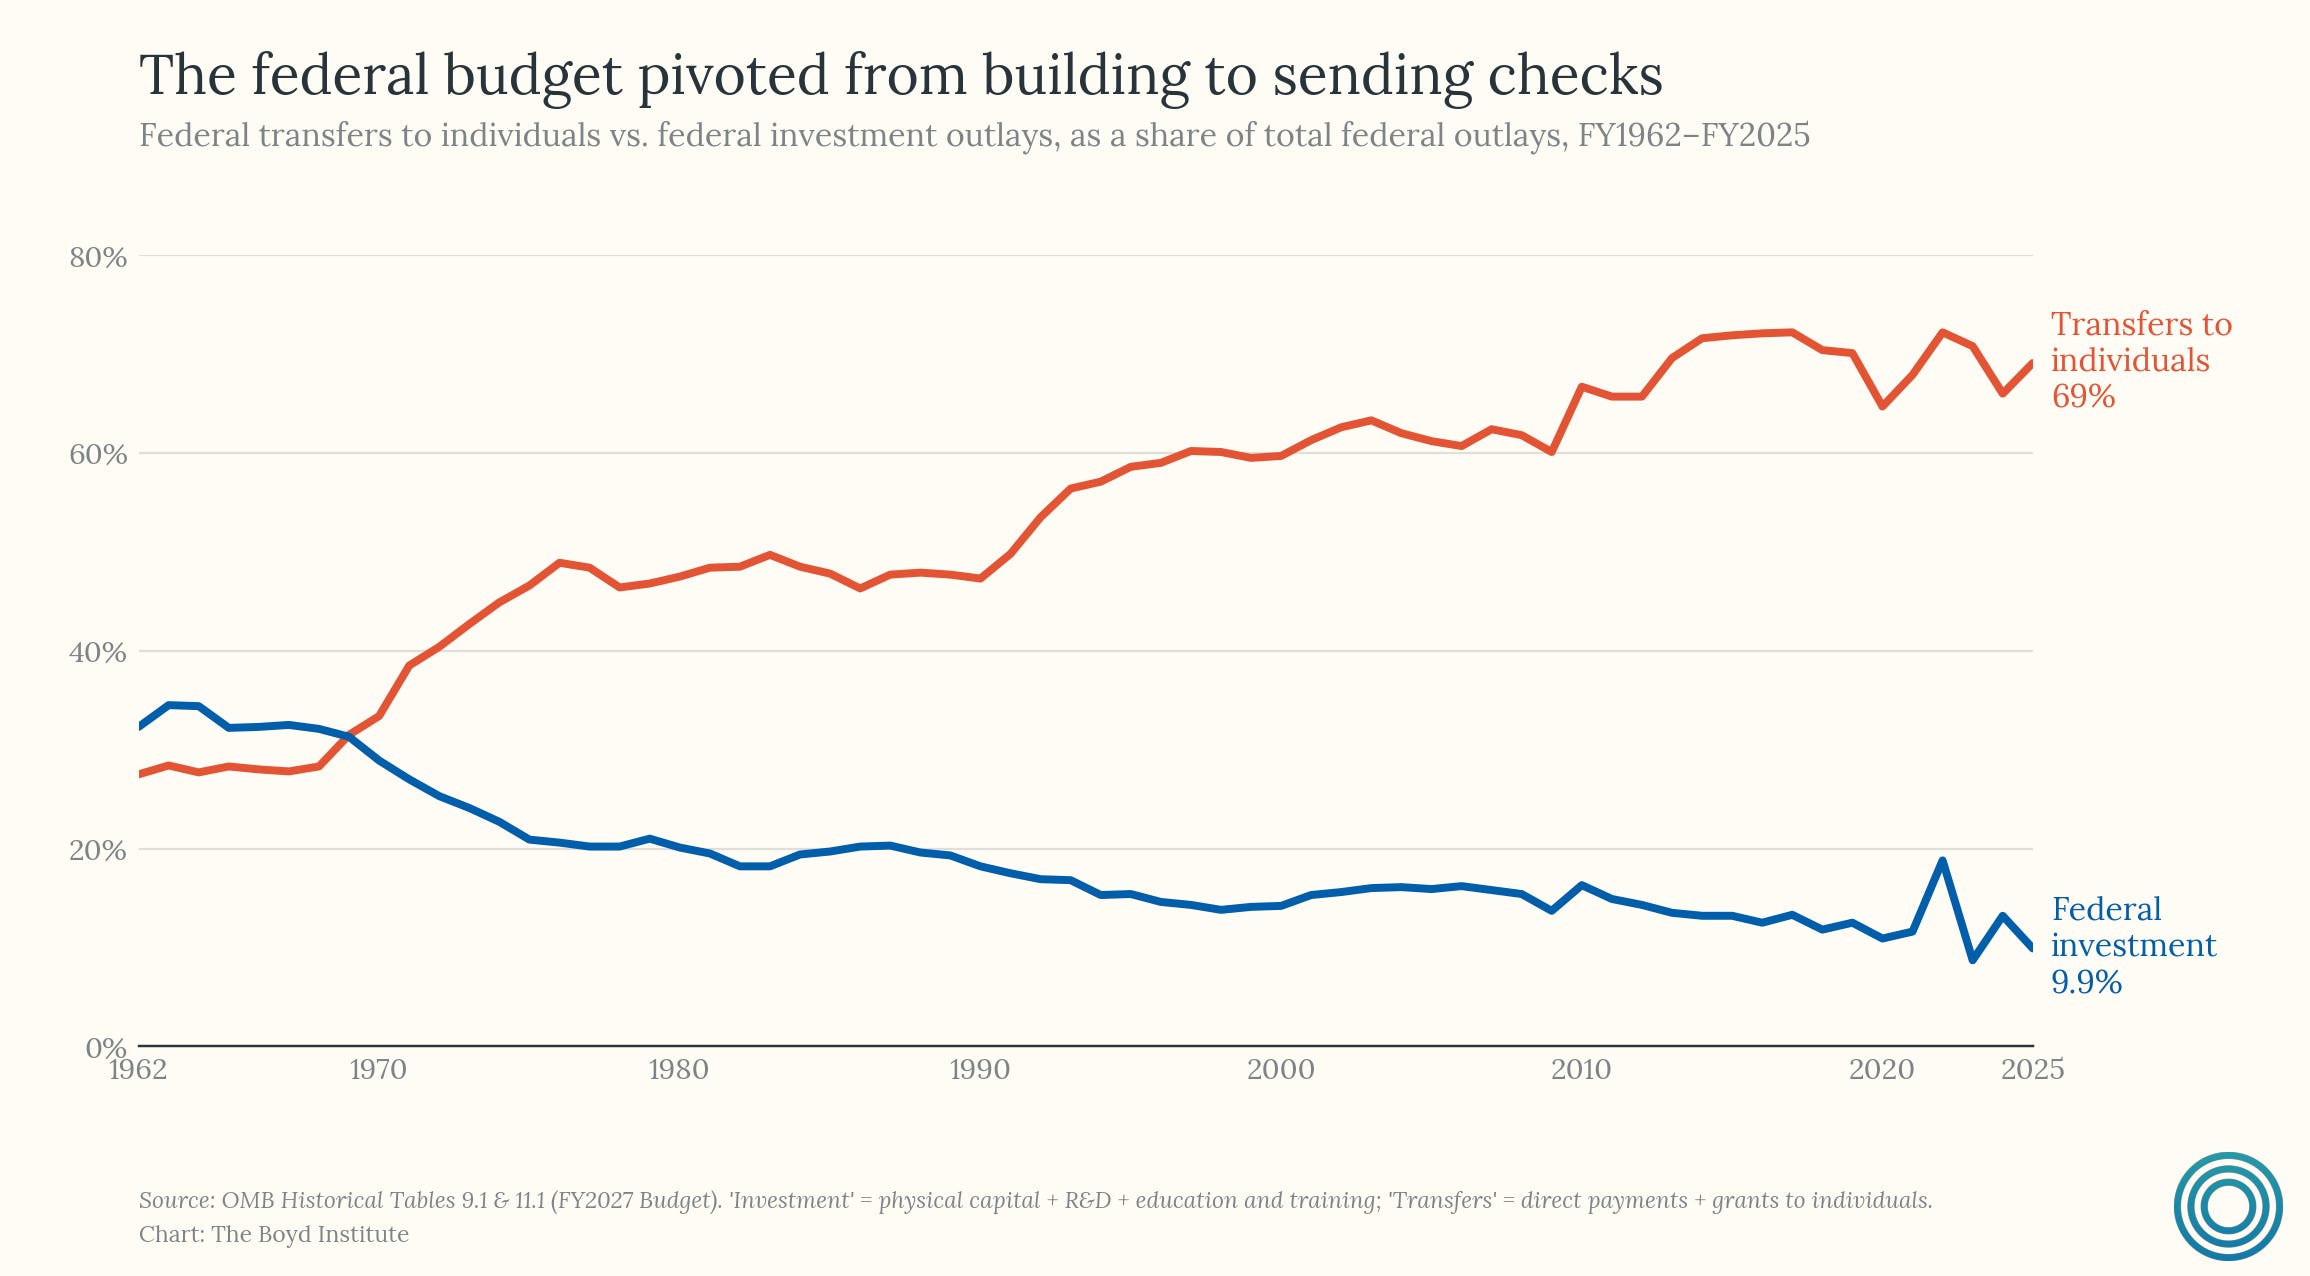
The economic implications of this shift are significant, because the multiplier effects of different types of government spending are not equivalent. A 2015 meta-regression analysis of 104 studies found that public investment multipliers are roughly 0.5 units larger than those of general spending, which itself runs about 0.3 to 0.4 units higher than tax cuts and transfer multipliers. When the marginal federal dollar is going to consumption rather than capacity, the growth dividend of deficit spending shrinks.
Today’s deficits are financing consumption, not investment — and this matters enormously for the sustainability question, because the only realistic exit from the debt spiral, as established above, runs through productivity growth. Every dollar that goes to bondholders is a dollar that cannot be used to build future capacity through research, infrastructure, education, or public investment. The federal budget should logically be tilting toward these growth-enhancing uses, yet it is moving in the opposite direction.
There is a related point about how this dynamic interacts with discretionary spending cuts. As entitlement programs grow automatically, the dollars available for everything else — state capacity, public science, effective development programs — shrink. The composition of spending deteriorates not through any explicit decision, but through the mechanical expansion of mandatory programs crowding out everything else.
Part II: Why the Root Problems Remain Unaddressed
4) America has made it easy to cut taxes and politically impossible to raise them.
Cutting taxes is easy and politically expedient. Raising taxes is, in practice, near-impossible for either party. The right treats it as ideological apostasy; the left prefers targeting narrow constituencies — the ultra-wealthy, corporations — rather than broadening the base in ways that would meaningfully close the gap.
This asymmetry has a name and an origin story. In 1976, the economist Jude Wanniski articulated what he called the “Two Santa Claus” theory: Democrats win votes by handing out government programs, playing Santa with public money, and Republicans cannot beat that by being the party of “no.” They need their own Santa, and tax cuts are it. The result is a system in which one party hands out spending and the other hands out tax cuts, and neither has any electoral incentive to do the unrewarding work of closing the gap between them.
What this dynamic produces is a one-way ratchet effect.
The Bush tax cuts of 2001 and 2003 reduced revenue substantially over their initial windows and were eventually made largely permanent. The Trump tax cuts of 2017 (TCJA) added an estimated $1.5 to $2 trillion to deficits over a decade. The 2025 “One Big Beautiful Bill” extended and expanded these provisions further. Each round reduces the revenue baseline; meanwhile none is offset by corresponding spending reductions. And the “temporary” provisions become permanent through sheer political gravity — no legislator wants to be the one who “raised taxes” by allowing a cut to expire. (This also corrupts the official fiscal projections, which will be discussed in ground truth five.)
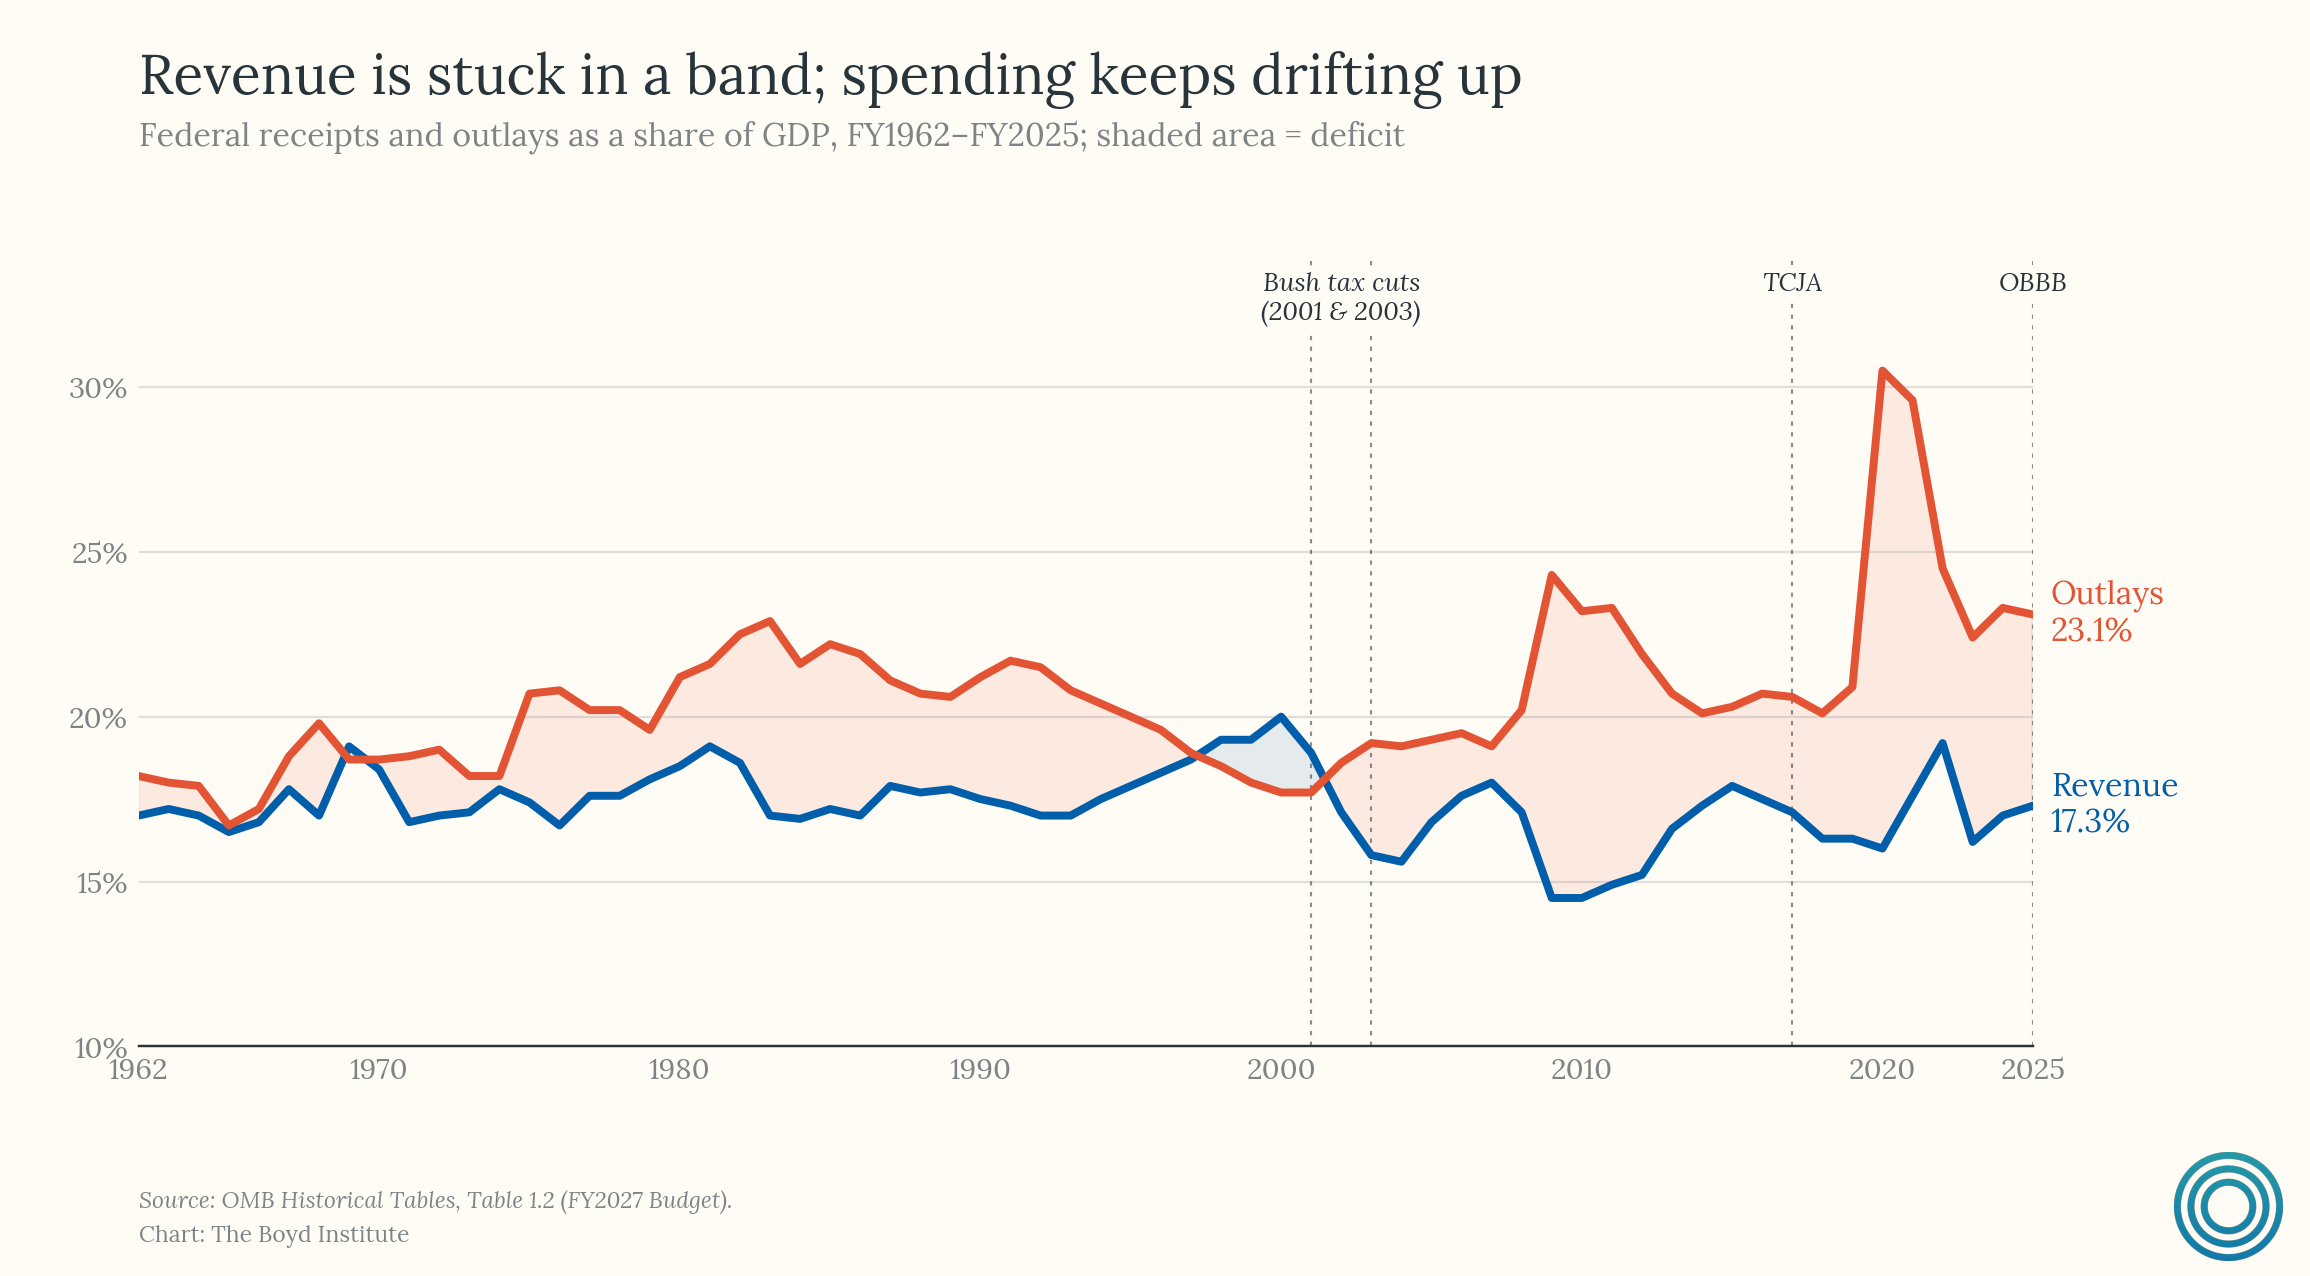
For decades, many Republicans and free-market economists — including Nobel laureates Milton Friedman and Gary Becker — argued that cutting taxes was itself a form of fiscal discipline: “starve the beast,” force Washington to reduce spending by reducing its revenue. A 2006 Cato Institute paper by economist William Niskanen put this theory to the test and found it wanting. Between 1981 and 2005, tax cuts and spending increases moved largely in tandem — lower revenues coincided with higher relative spending, not lower. The beast was not starved; it simply ran up a tab.
The structural deficit thus widens as the political system can only move in one direction on taxes and the promised corrective on the spending side never arrives.
5) The national debt has compounded exponentially while voters — and the CBO — think linearly.
During the early weeks of the COVID-19 pandemic, the writer Tomas Pueyo went viral1 for demonstrating what happens when exponential dynamics collide with linear intuition: people catastrophically underestimate the trajectory until the curve has already steepened past the point of easy intervention.
The national debt crisis is a slow-motion version of the same cognitive failure. People look at the deficit and extrapolate in a straight line. What they fail to grasp is that the curve is steepening — interest payments compounding on a growing principal at higher rates, political-economic barriers to fiscal hawkishness, and mandatory spending accelerating as demographics shift. The problem, as compounding problems do, arrives gradually and then suddenly.
What makes this worse is that the institution designed to translate fiscal reality into smart policy has, in the recent period, suffered from its own version of linear bias. The CBO's own 2024 retrospective was careful to point out that across four decades the agency's deficit projections have been roughly symmetric in error — sometimes too high, sometimes too low. But the same report concedes the most important fact:
"Errors in CBO's deficit projections have been substantially smaller than the estimated budgetary effects of legislation enacted after the projections were made."
When Congress acts, the actuals diverge — and over the last decade Congress has acted almost exclusively in one direction.
The result is a string of underestimates that no longer look symmetric. In January 2014, the CBO's Budget and Economic Outlook projected federal debt held by the public would reach $20.9 trillion by FY2024. The actual figure was $28.2 trillion — a 35% understatement on the level. By FY2025, debt had climbed to $30.2 trillion, $9 trillion (or 42%) past what CBO had pencilled in just a decade earlier.
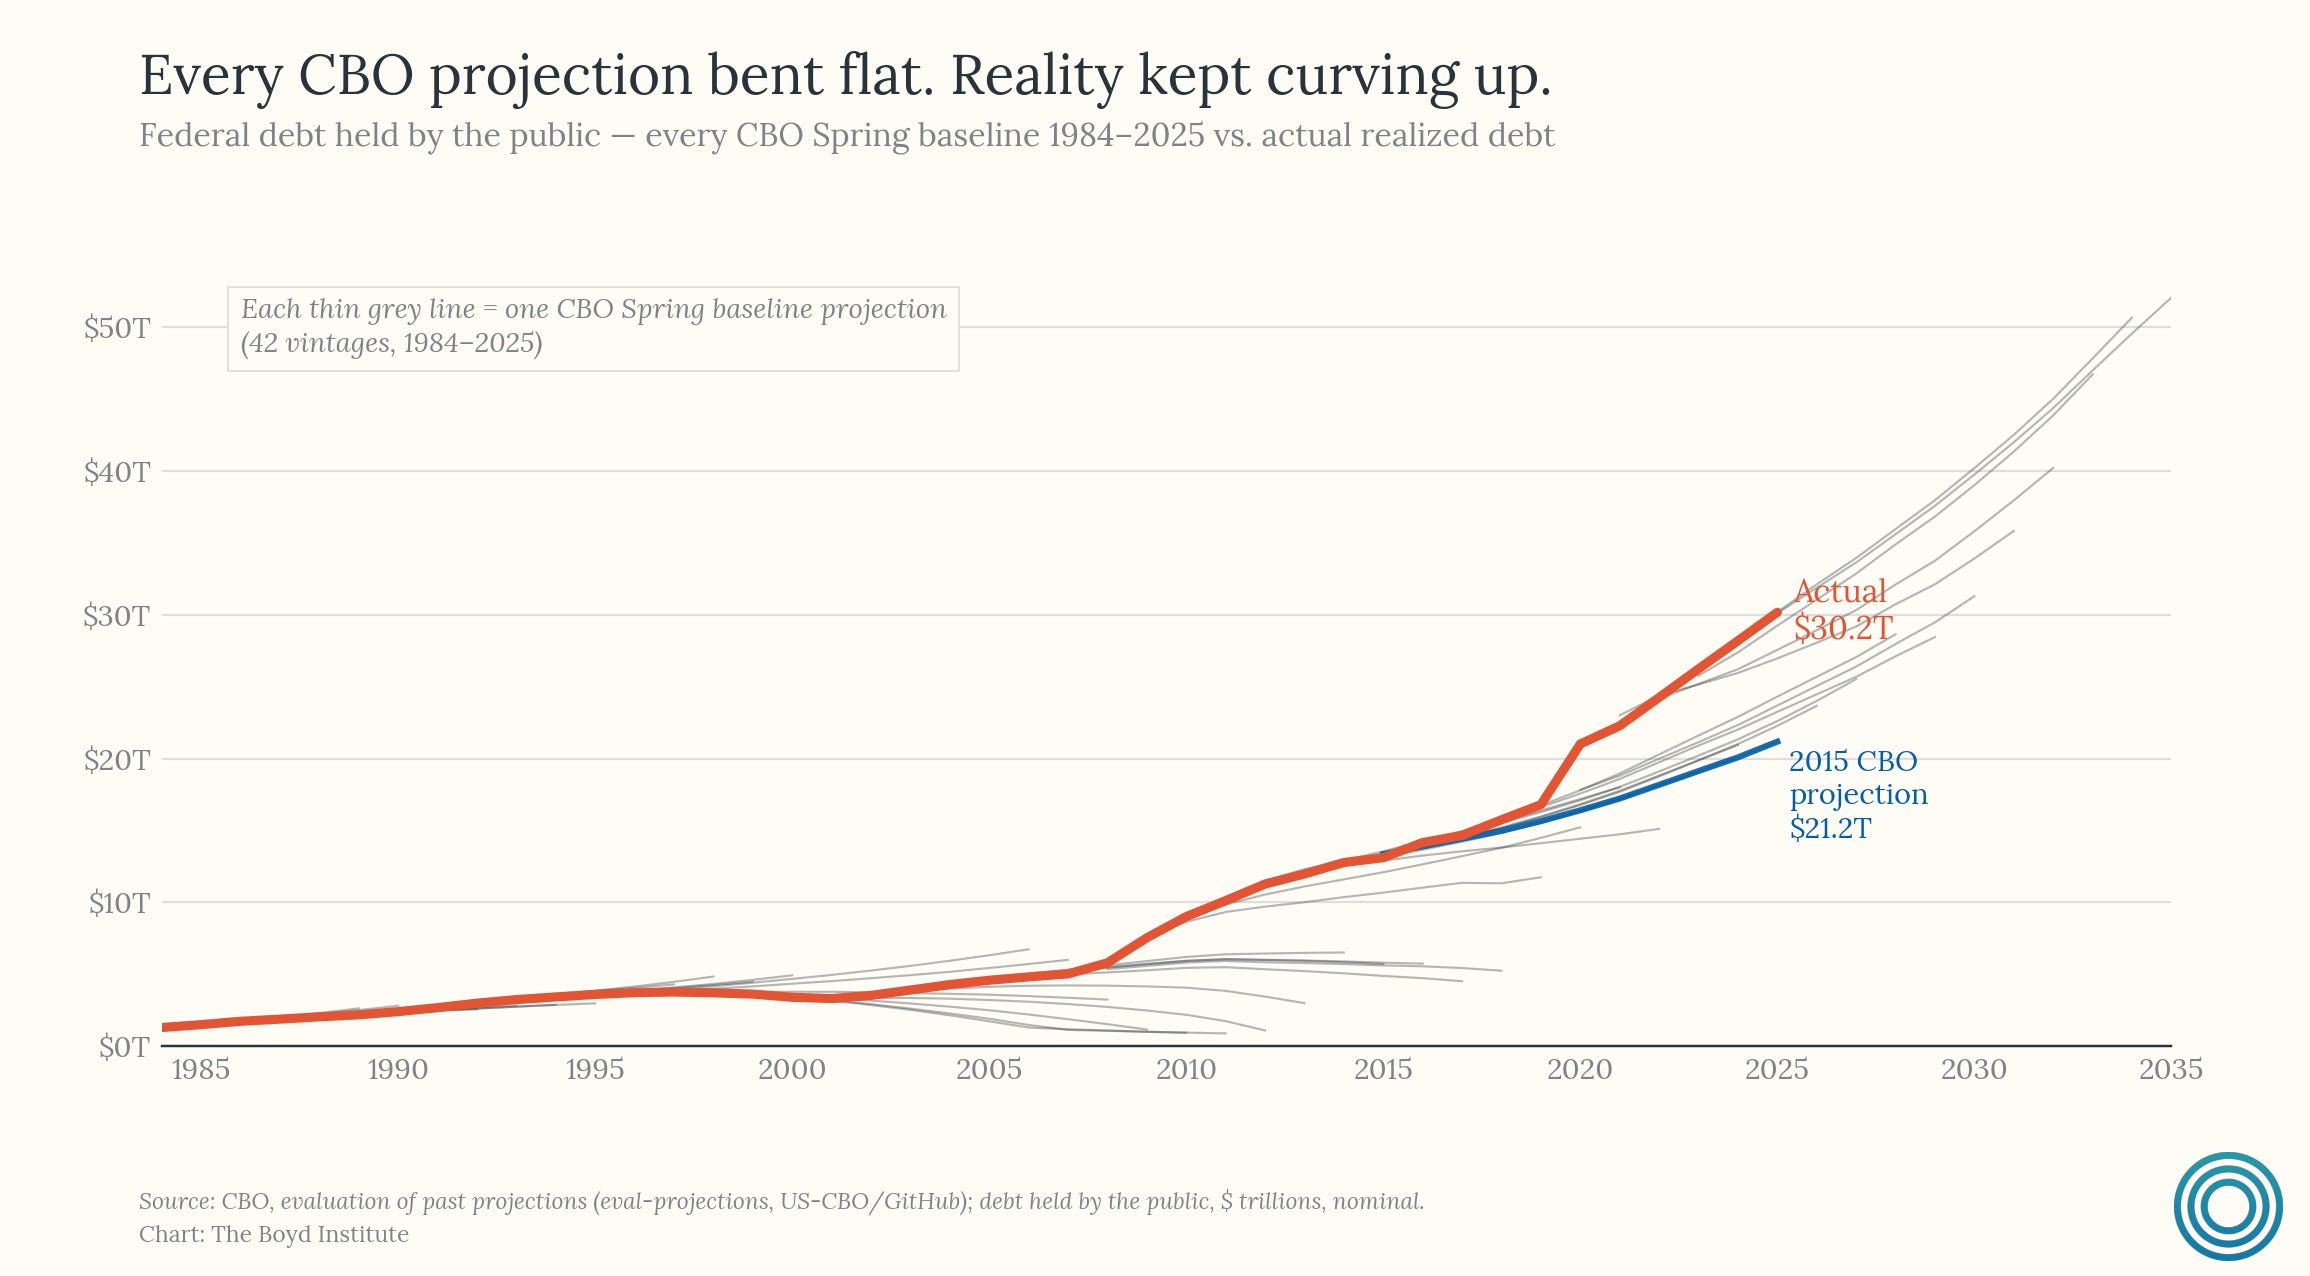
The issue lies with the CBO’s methodology. It scores under a current-law baseline and therefore cannot anticipate future legislative changes: tax cuts extended, spending bills passed, emergencies, and pandemics. But real-world changes almost always go in one direction: more spending, less revenue. So the very institution whose projections are supposed to impose fiscal discipline on Congress is, by construction, structurally incapable of capturing what Congress is actually about to do.2
The compounding paradox is that the public can't intuit the curve, and the expert institution that's supposed to intuit it for them is methodologically prevented from seeing past the next bill Congress hasn't passed yet. When both main inputs into the political process are biased in the same direction, by the time the numbers become politically salient, the window for painless correction will have long since closed.
6) Status quo bias pushes against entitlement reform.
Human beings experience losses more intensely than equivalent gains. Behavioral economists call this loss aversion, and in democratic politics it creates an overwhelming status quo bias around large entitlement programs. Voters evaluate proposed reforms not relative to long-term fiscal sustainability, but relative to the benefits they currently expect to receive. A future reduction in projected benefits is experienced psychologically as an immediate loss, even if the system itself is unsustainable under current law.
This creates a profound asymmetry in democratic incentives. The benefits of entitlement reform are diffuse, long-term, and often statistical: lower future debt burdens, reduced interest costs, greater fiscal flexibility decades from now. The costs, by contrast, are immediate, concentrated, and politically legible. A retiree notices a higher eligibility age. A worker notices a payroll tax increase. A future fiscal crisis, meanwhile, remains abstract.
The dynamic becomes even more powerful because entitlement beneficiaries are disproportionately politically engaged. The American electorate is older than it has ever been, older voters turn out at substantially higher rates than younger ones, and Social Security and Medicare recipients are among the most reliable voting blocs in the country.
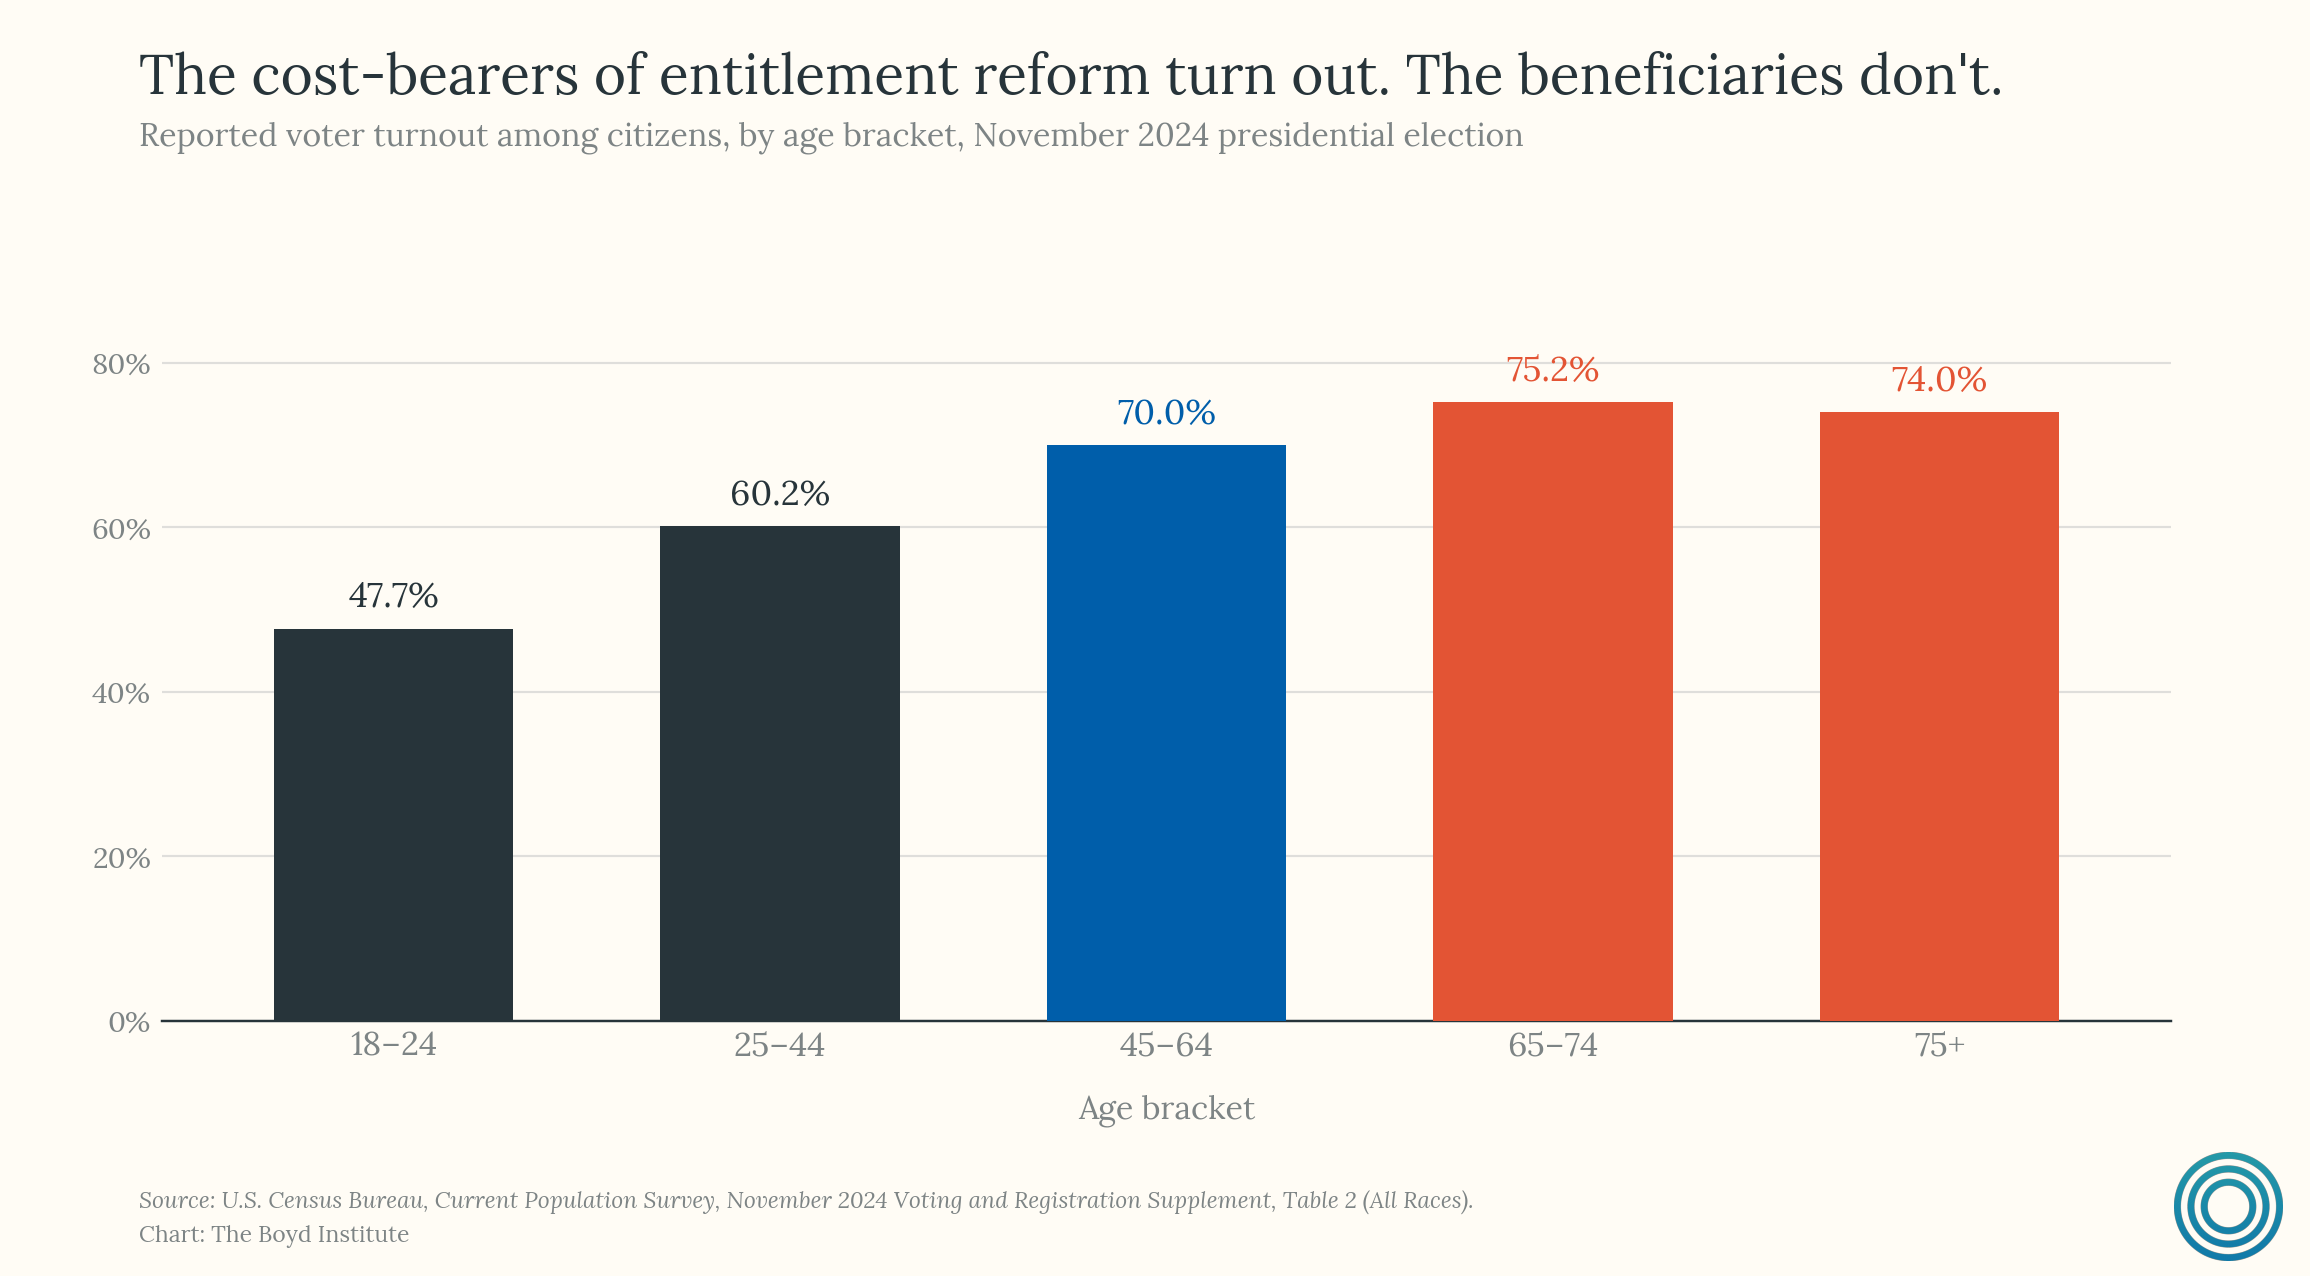
Politicians, therefore, face a straightforward electoral calculation: the people who would bear the immediate costs of reform are far more politically active than the people who would benefit from long-run fiscal stabilization. So any rational politician treats entitlement reform as a non-starter.
7) “Waste, fraud, and abuse,” though not insignificant, is small in comparison to structural deficit drivers.
Ask a voter what's driving the deficit and you will hear about bloated bureaucracies, foreign aid, welfare fraud, and government waste. These problems are real, and they aren't small in absolute terms. The Government Accountability Office estimates the federal government loses between $233 and $521 billion annually to fraud, plus another $186 billion to improper payments. At the upper end, that's more than a third of the FY2025 federal deficit. Any serious fiscal program should be attacking this — and it's one of the more durable points of bipartisan agreement that it should.
But scale matters. Even taking the most aggressive GAO estimate of fraud, adding every dollar of improper payments on top, and then eliminating the entire non-defense discretionary budget — the entire Department of Education, all of NASA, the whole foreign aid envelope, every dollar of it — the combined total still falls short of closing the FY2025 deficit. The arithmetic is the point.
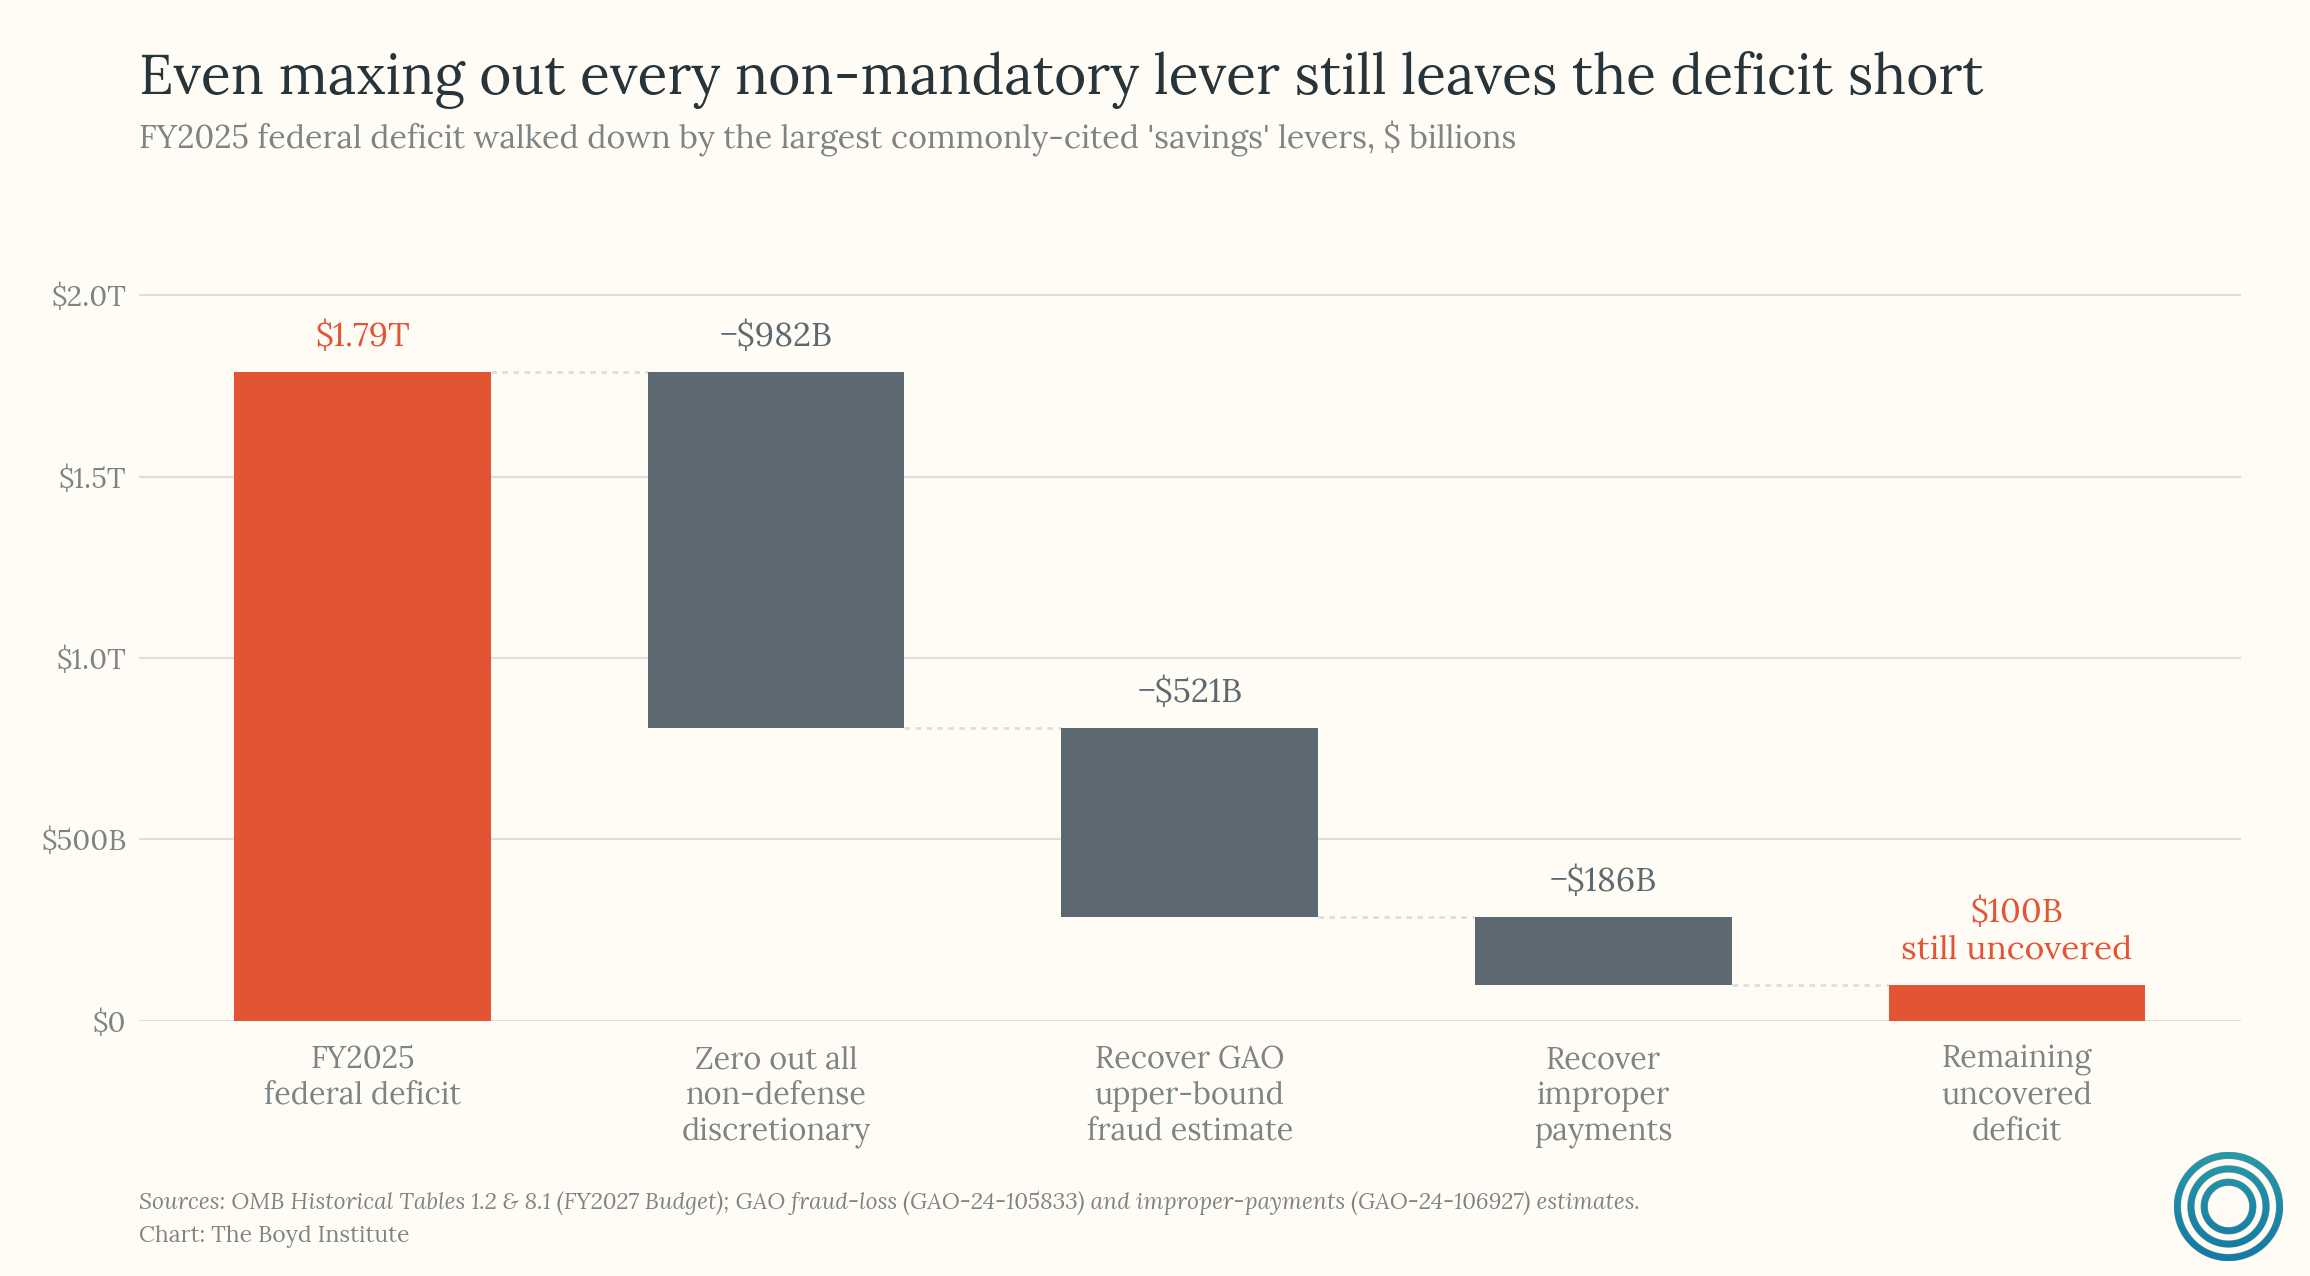
Mandatory spending — Social Security, Medicare, Medicaid, and related programs — plus net interest now accounts for roughly 75% of the federal budget, and rising. Everything else is a small and shrinking share. The deficit-closing math, regrettably, runs through the programs voters most want to protect.
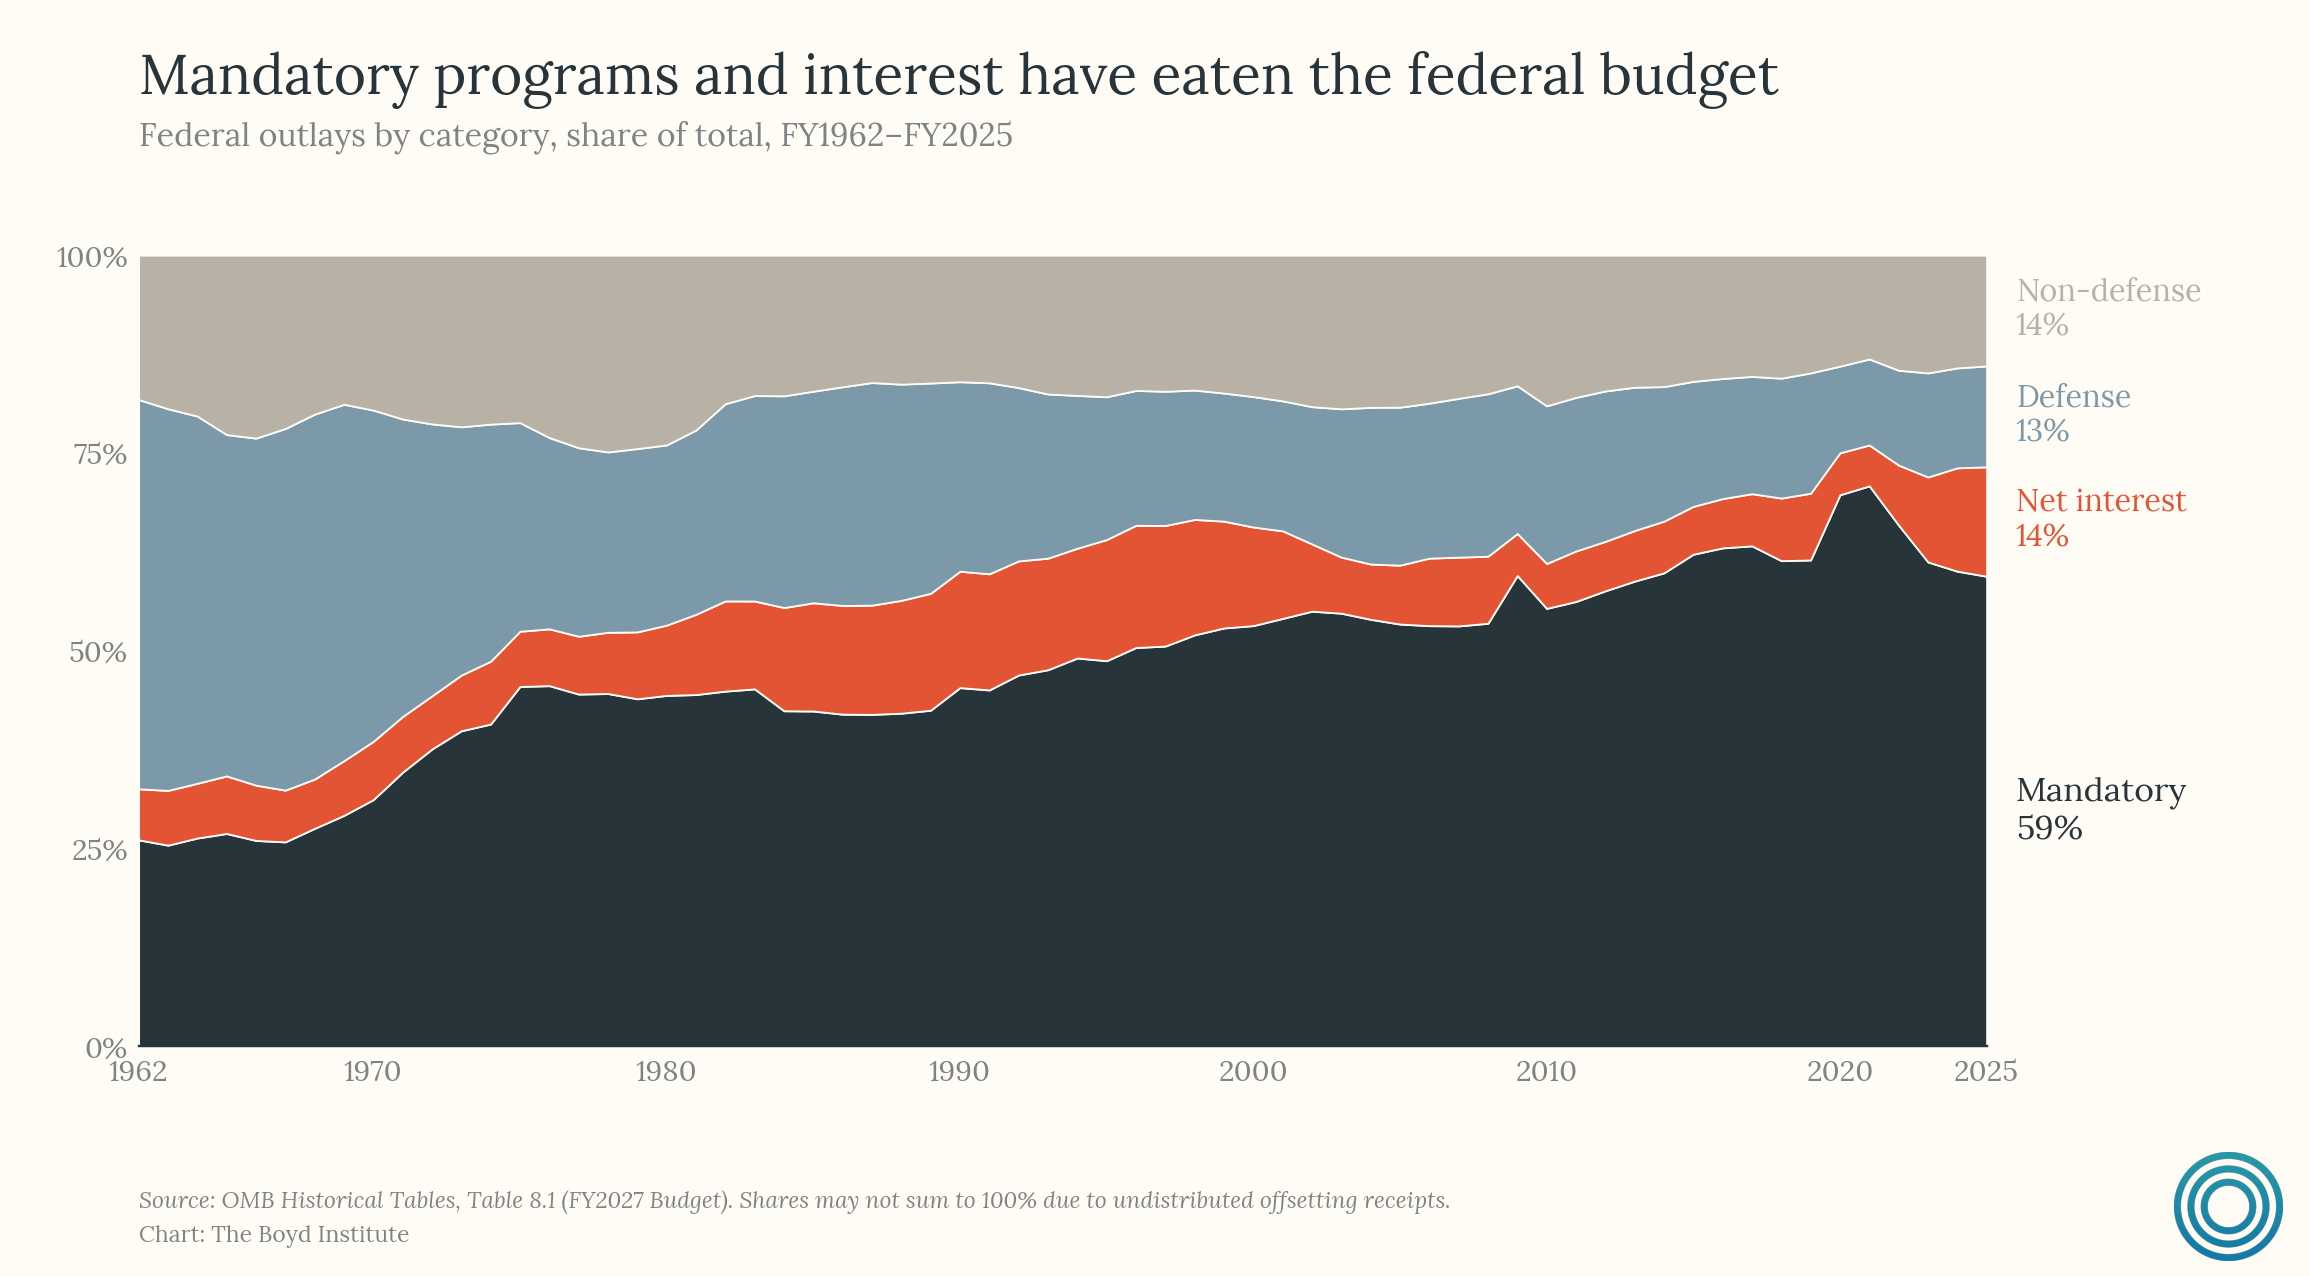
It may be a stretch to call it “cope,” but the waste-fraud-abuse trope is durable in part because, politically, it offers everyone something. Voters get to feel righteous about government inefficiency without confronting the fact that the programs they personally benefit from are the programs driving the crisis. Politicians get to posture about accountability without touching anything that would cost them votes. And reformers get to do real, useful work — every dollar reclaimed from an improper payment is a dollar that didn’t have to be borrowed. The work is necessary; it just isn’t sufficient. The recent flagship attempt to convert this narrative into actual savings made the point unintentionally clear, which we’ll turn to next.
8) DOGE was slopulism, and largely counterproductive.
If “waste, fraud, and abuse” was the popular narrative, DOGE was its institutional apotheosis — the logical endpoint of a populist framing that substitutes the identification of villains for dispassionate budgetary analysis. The core premise was that the deficit is driven by bureaucratic bloat, and that a sufficiently aggressive outsider could close it by axing headcount.
Discretionary overhead — the territory DOGE actually targeted — is a small and shrinking share of federal spending. As the previous section showed, even zeroing out the entire non-defense discretionary budget falls short of closing the FY2025 deficit. DOGE's own topline estimate (last updated Jan. 1, 2026) claims $215 billion in savings, which works out to about 12% of the FY2025 federal deficit — and that was the claim, not the verified figure. Independent reviews documented closer to $2 billion in actual savings: less than one one-hundredth of the claim, and about one-tenth of one percent of the deficit. The most generous third-party estimate (Kellogg's analysis via Fortune, roughly 20% of the claimed total) still tops out around $38 billion — a fraction of what would be needed to materially bend the curve.
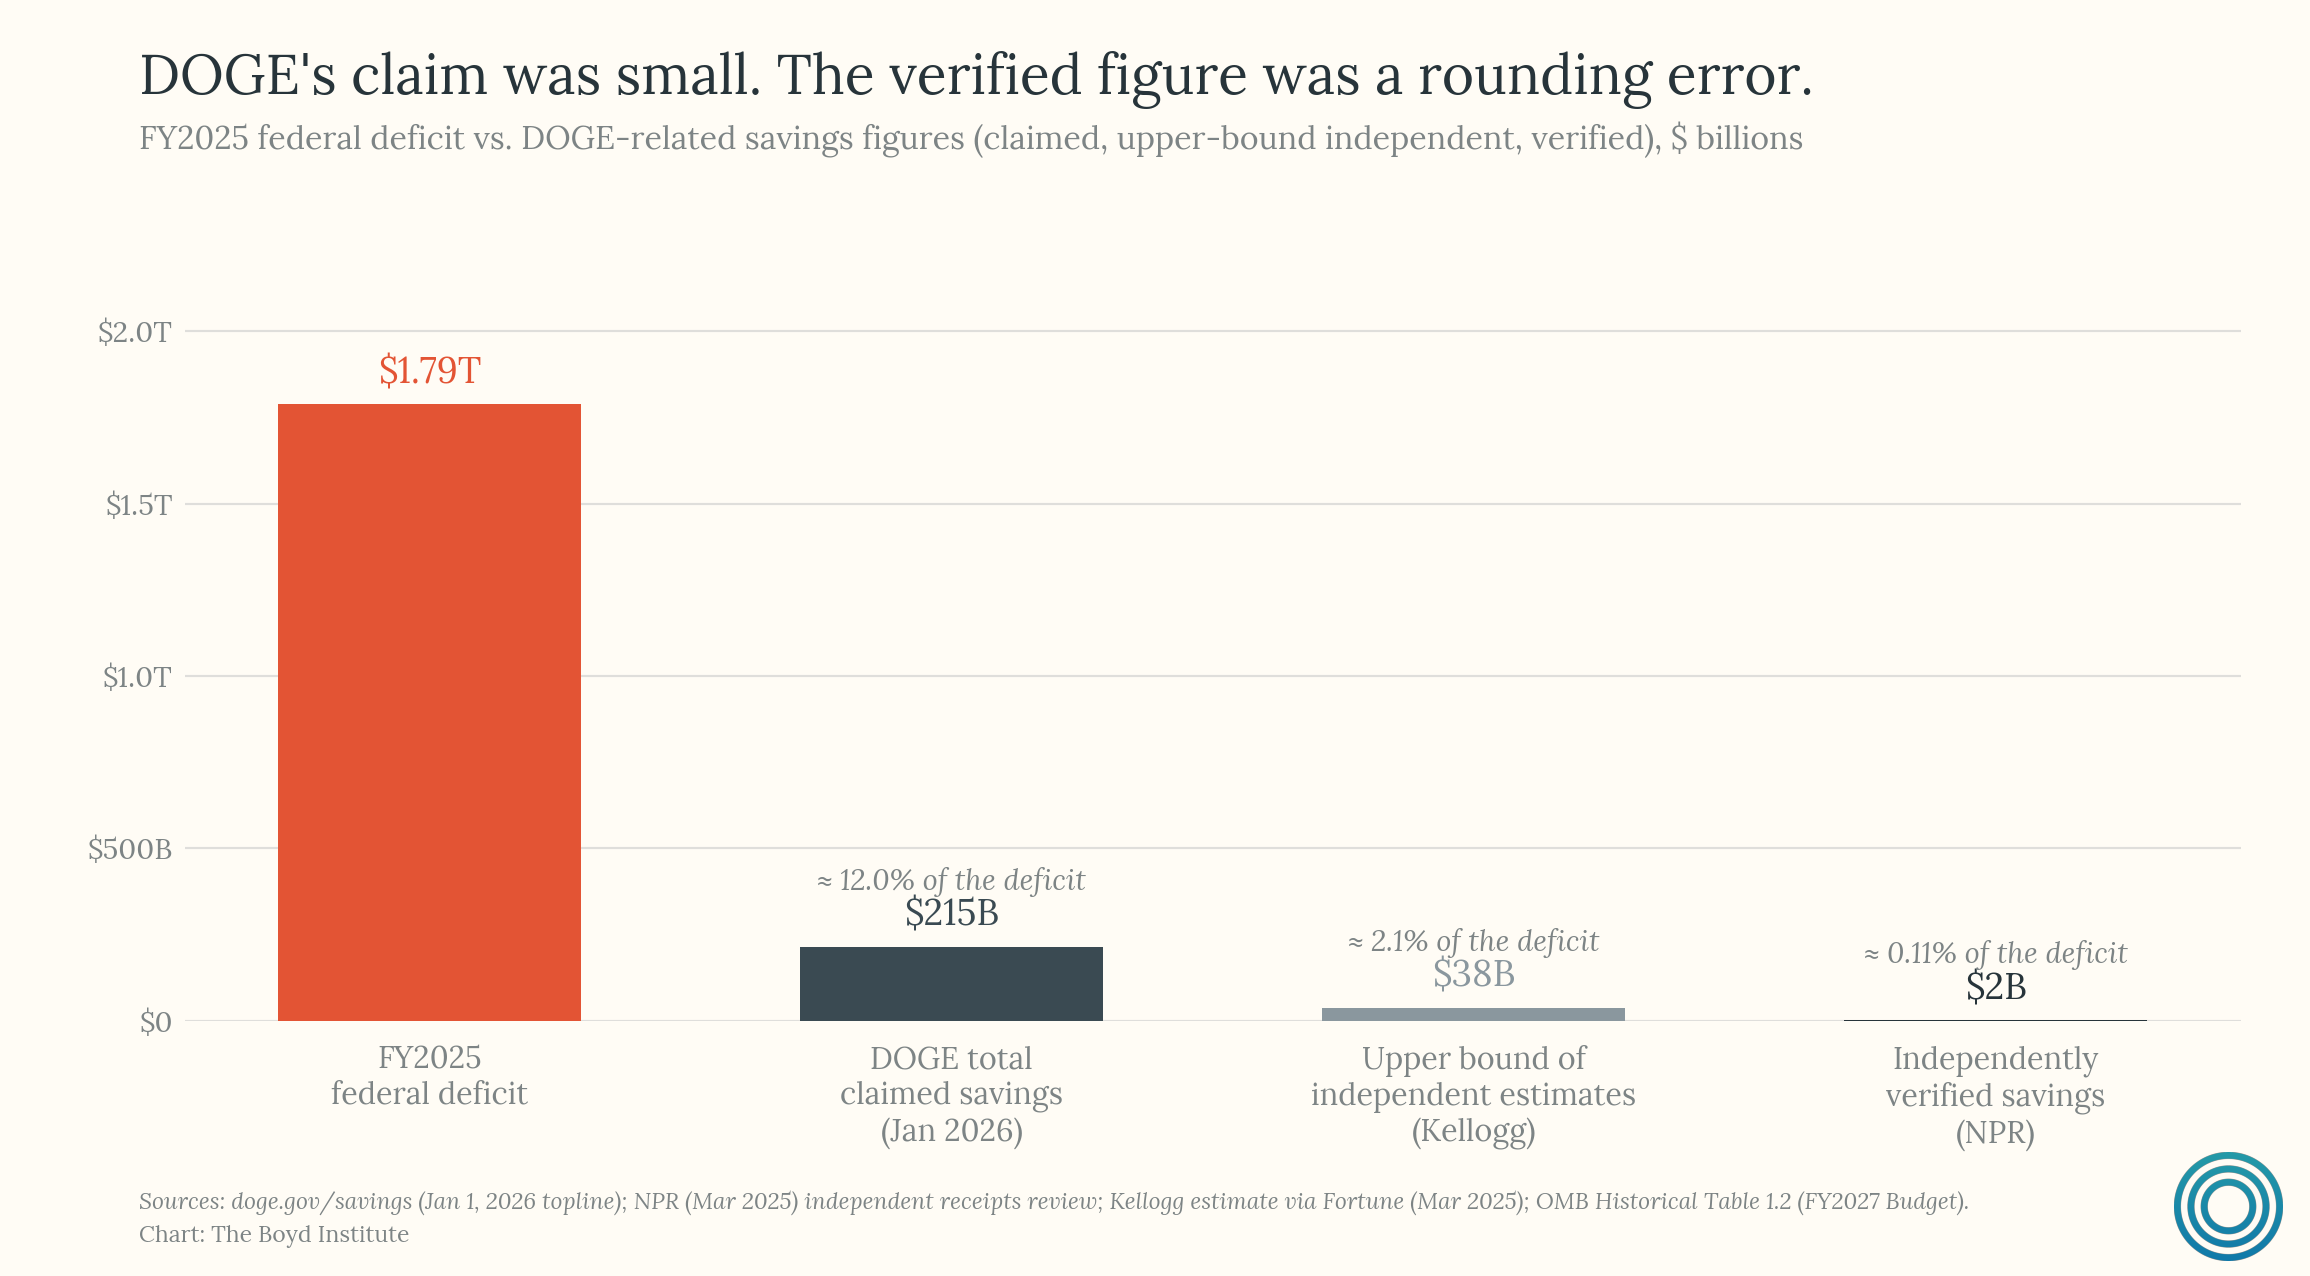
Worse, DOGE not only failed to meaningfully chip away at the problem but it created new ones. The FAA case is instructive. In February 2025, approximately 400 FAA personnel were laid off — not air traffic controllers directly, but the support staff who keep the system functional: aviation safety assistants, maintenance mechanics, aeronautical information specialists. Each aviation safety assistant typically supported roughly 10 safety inspectors. Removing them degraded the capacity of the people who remained without producing meaningful fiscal savings. By spring, Newark Liberty was experiencing severe disruptions, with United Airlines cancelling 35 daily round-trip flights as staffing shortages and system failures compounded.3
Perhaps the most consequential damage was to research and science funding. The US attracts world-class talent in large part because of its research ecosystem — NIH, NSF, the national laboratories, the university system undergirded by federal grants. That infrastructure is a direct input into the productivity boom that, as established in ground truth number two, is the only palatable exit from the debt spiral. Cutting research funding to save money on the deficit actively destroys a fundamental driver of the growth needed to outrun the debt. The consequences of this may take decades to fully manifest, and the US’ position as the world’s elite destination for scientific human capital is not something easily rebuilt once degraded.
Meanwhile, to reiterate: the programs that actually drive the deficit — e.g., mandatory spending and entitlements — went untouched.
Part III: It’s the Entitlement Spending, Stupid
9) Social Security has fundamental design issues.
The standard critique of Social Security's unsustainability is demographic: fewer workers per retiree, longer lifespans, an inverted population pyramid. All true. The worker-to-retiree ratio fell from 5.1 in 1960 to roughly 2.7 today, and it is projected to hit 2.2 by 2050.
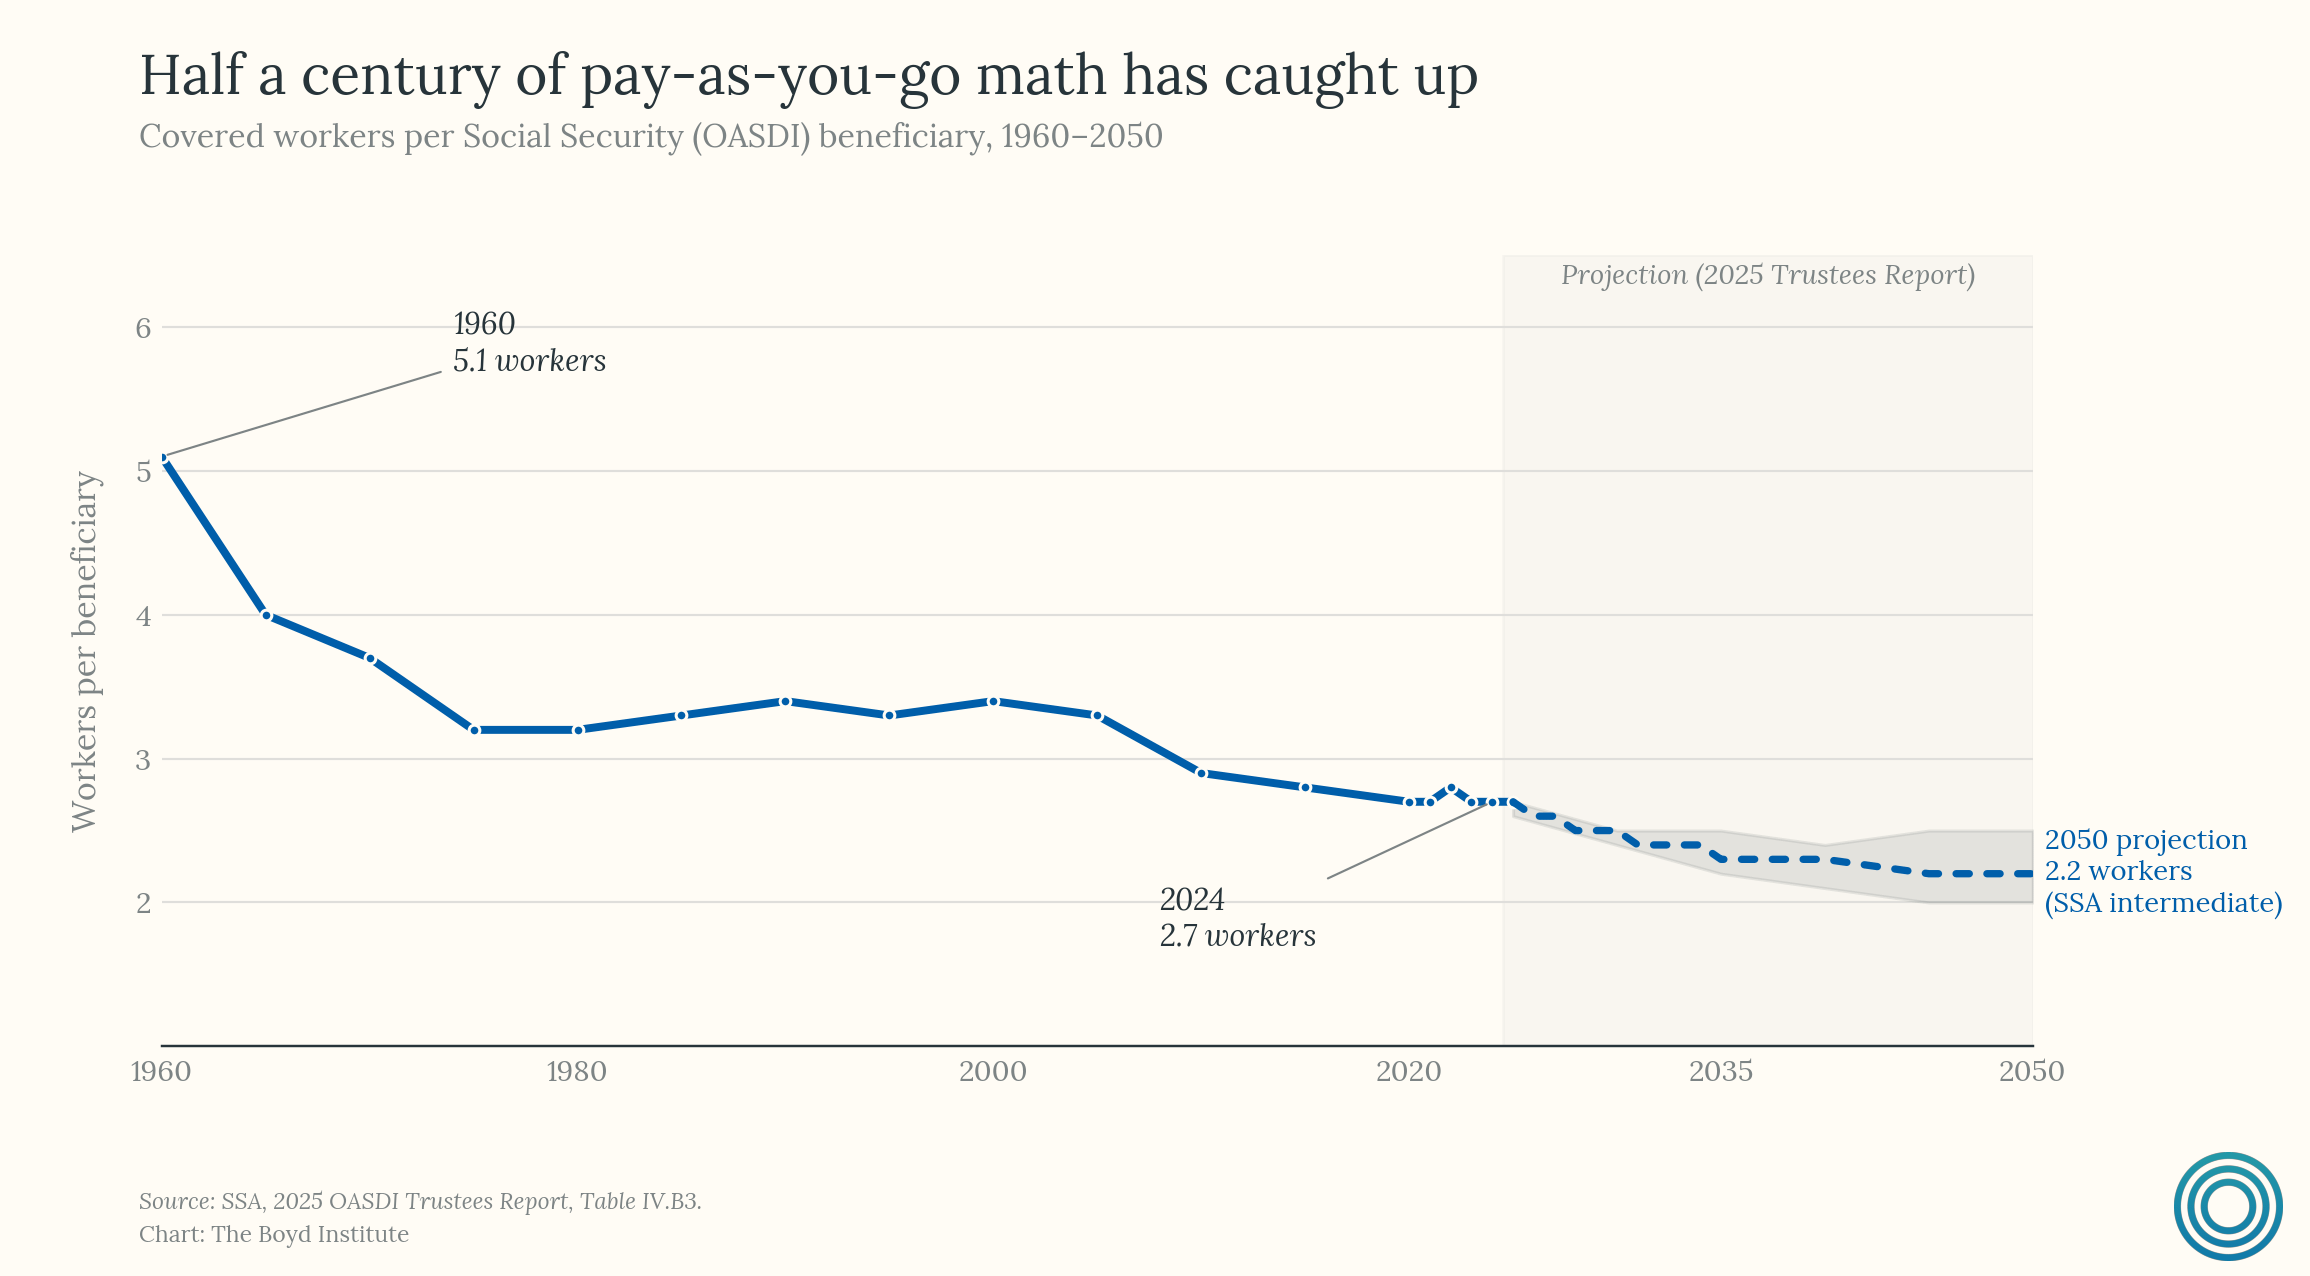
But there is a deeper architectural feature that rarely gets discussed, one that compounds the demographic problem rather than being caused by it. Social Security indexes initial benefits to wages, not prices. Your initial benefit is calculated based on an index of average wages at the time you retire. So if productivity-driven real wage growth runs at 1.5% annually over a 40-year career, the real benefit level at retirement is substantially higher than it would be under pure price indexing.
This is a deliberate design choice — it was meant to preserve a roughly constant wage-replacement rate for retirees from one cohort to the next, so that successive generations of beneficiaries wouldn't fall behind the living standards of the workers funding them. The problem is the asymmetry: while benefits grow automatically with wages, the payroll tax rate has been adjusted by Congress only sporadically, and the demographic ratio that determines how many workers fund each retiree's benefit is moving the wrong way. Revenues do rise with wages, but given current tax rates and demographics, the benefit formula's generosity now causes promised outlays to grow faster than dedicated contributions.
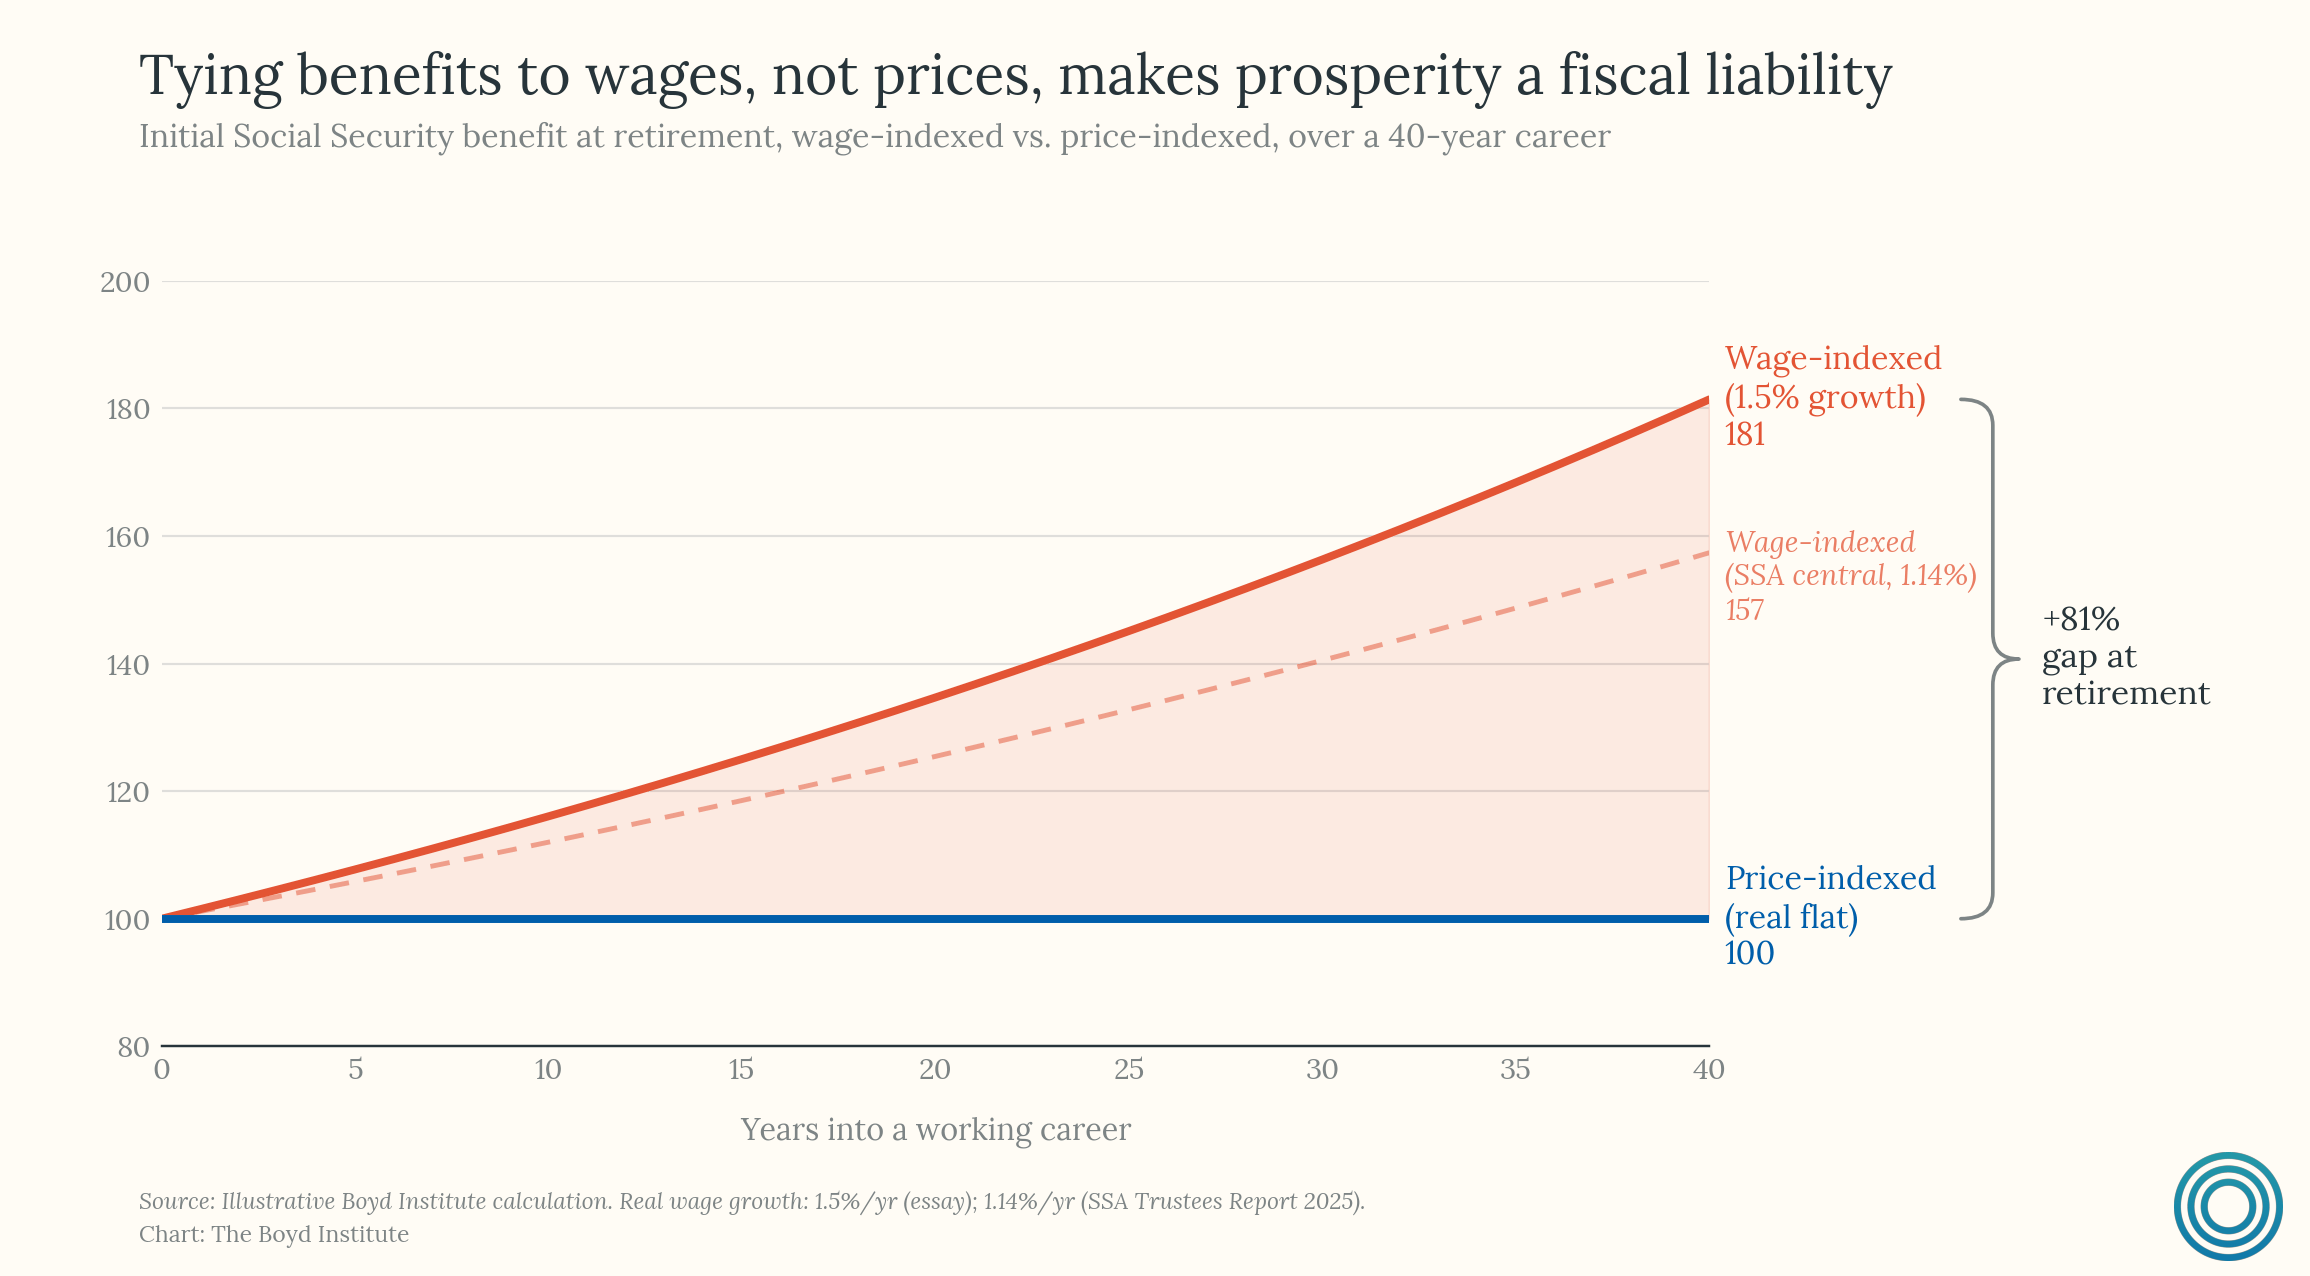
The irony is that real wage growth is perhaps the single most universally celebrated macroeconomic outcome. Left and right, economists and politicians — everyone agrees it is good. And it is good. But Social Security's designers built a system in which those gains automatically translate into higher benefit promises, without any parallel automatic adjustment on the revenue side. The better the economy performs in exactly the way everyone wants it to, the more aggressively the system needs to be reformed.
Then there is an additional compounding effect from price indexing itself. Social Security benefits are adjusted annually using the Consumer Price Index. Many economists argue that this overstates the true cost-of-living increase, because the CPI does not fully account for consumer substitution — the tendency of people to shift purchases when relative prices rise. The CBO has estimated that switching to the "chained CPI," which does account for substitution, would save $340 billion over a decade, including interest effects. Chained CPI is technocratically attractive but politically loaded: it would slow benefit growth and slow the indexing of tax brackets at the same time, which means it effectively raises taxes over time even as it reduces benefits. That dual hit is why the idea has been on the table for two decades without being enacted.
In 2005, the Bush administration proposed a reform known as "progressive price indexing" — maintaining wage indexing for the lowest 30% of earners while gradually shifting higher earners to price indexing. CBO analysis under its long-term assumptions showed it would have closed roughly 70% of Social Security's long-term financing gap by concentrating benefit reductions on the highest earners over time. The proposal was developed by financial analyst Robert Pozen, was analytically rigorous, and died quickly. The political system identified the design flaw, proposed a technically sound fix, and rejected it because the fix meant future retirees would receive less in real terms than the current formula promises — and the political system would not pay that cost in advance, even when shown the math.
It is difficult to imagine a cleaner illustration of the structural trap. And the trap is more constraining today than it was in 2005. The trust fund was projected to last until 2041 under the 2005 Trustees Report; under the 2025 report, it runs dry in 2034. In a system where benefits ratchet up automatically but contributions and broader budget policy do not, every year of inaction makes the eventual adjustment more abrupt — and more politically explosive.
10) Medicare's cost crisis is an architectural failure dressed up as a demographic one.
Medicare is in many ways a victim of its own success. When it was originally designed in the 1960s, it covered roughly 9.7 percent of the U.S. population — 19.1 million enrollees — a relatively small share for whom medical care at the time often meant either rapid recovery or death. Six decades later, it is financing the chronic disease management of a population using medical technology that didn’t exist when the program was designed, at costs that have outpaced both GDP growth and general inflation for decades.4
The conventional explanation for that is demographic — more retirees, longer lives, an inverted pyramid. But the math doesn’t support this explanation. Our analysis (the decomposition below) splits real Medicare program growth from 1967 to 2024 into three multiplicative factors: new beneficiary inflow, years each cohort spends on the program, and real cost per beneficiary-year. Those factors multiply to the actual 26× real growth in annual spending.5
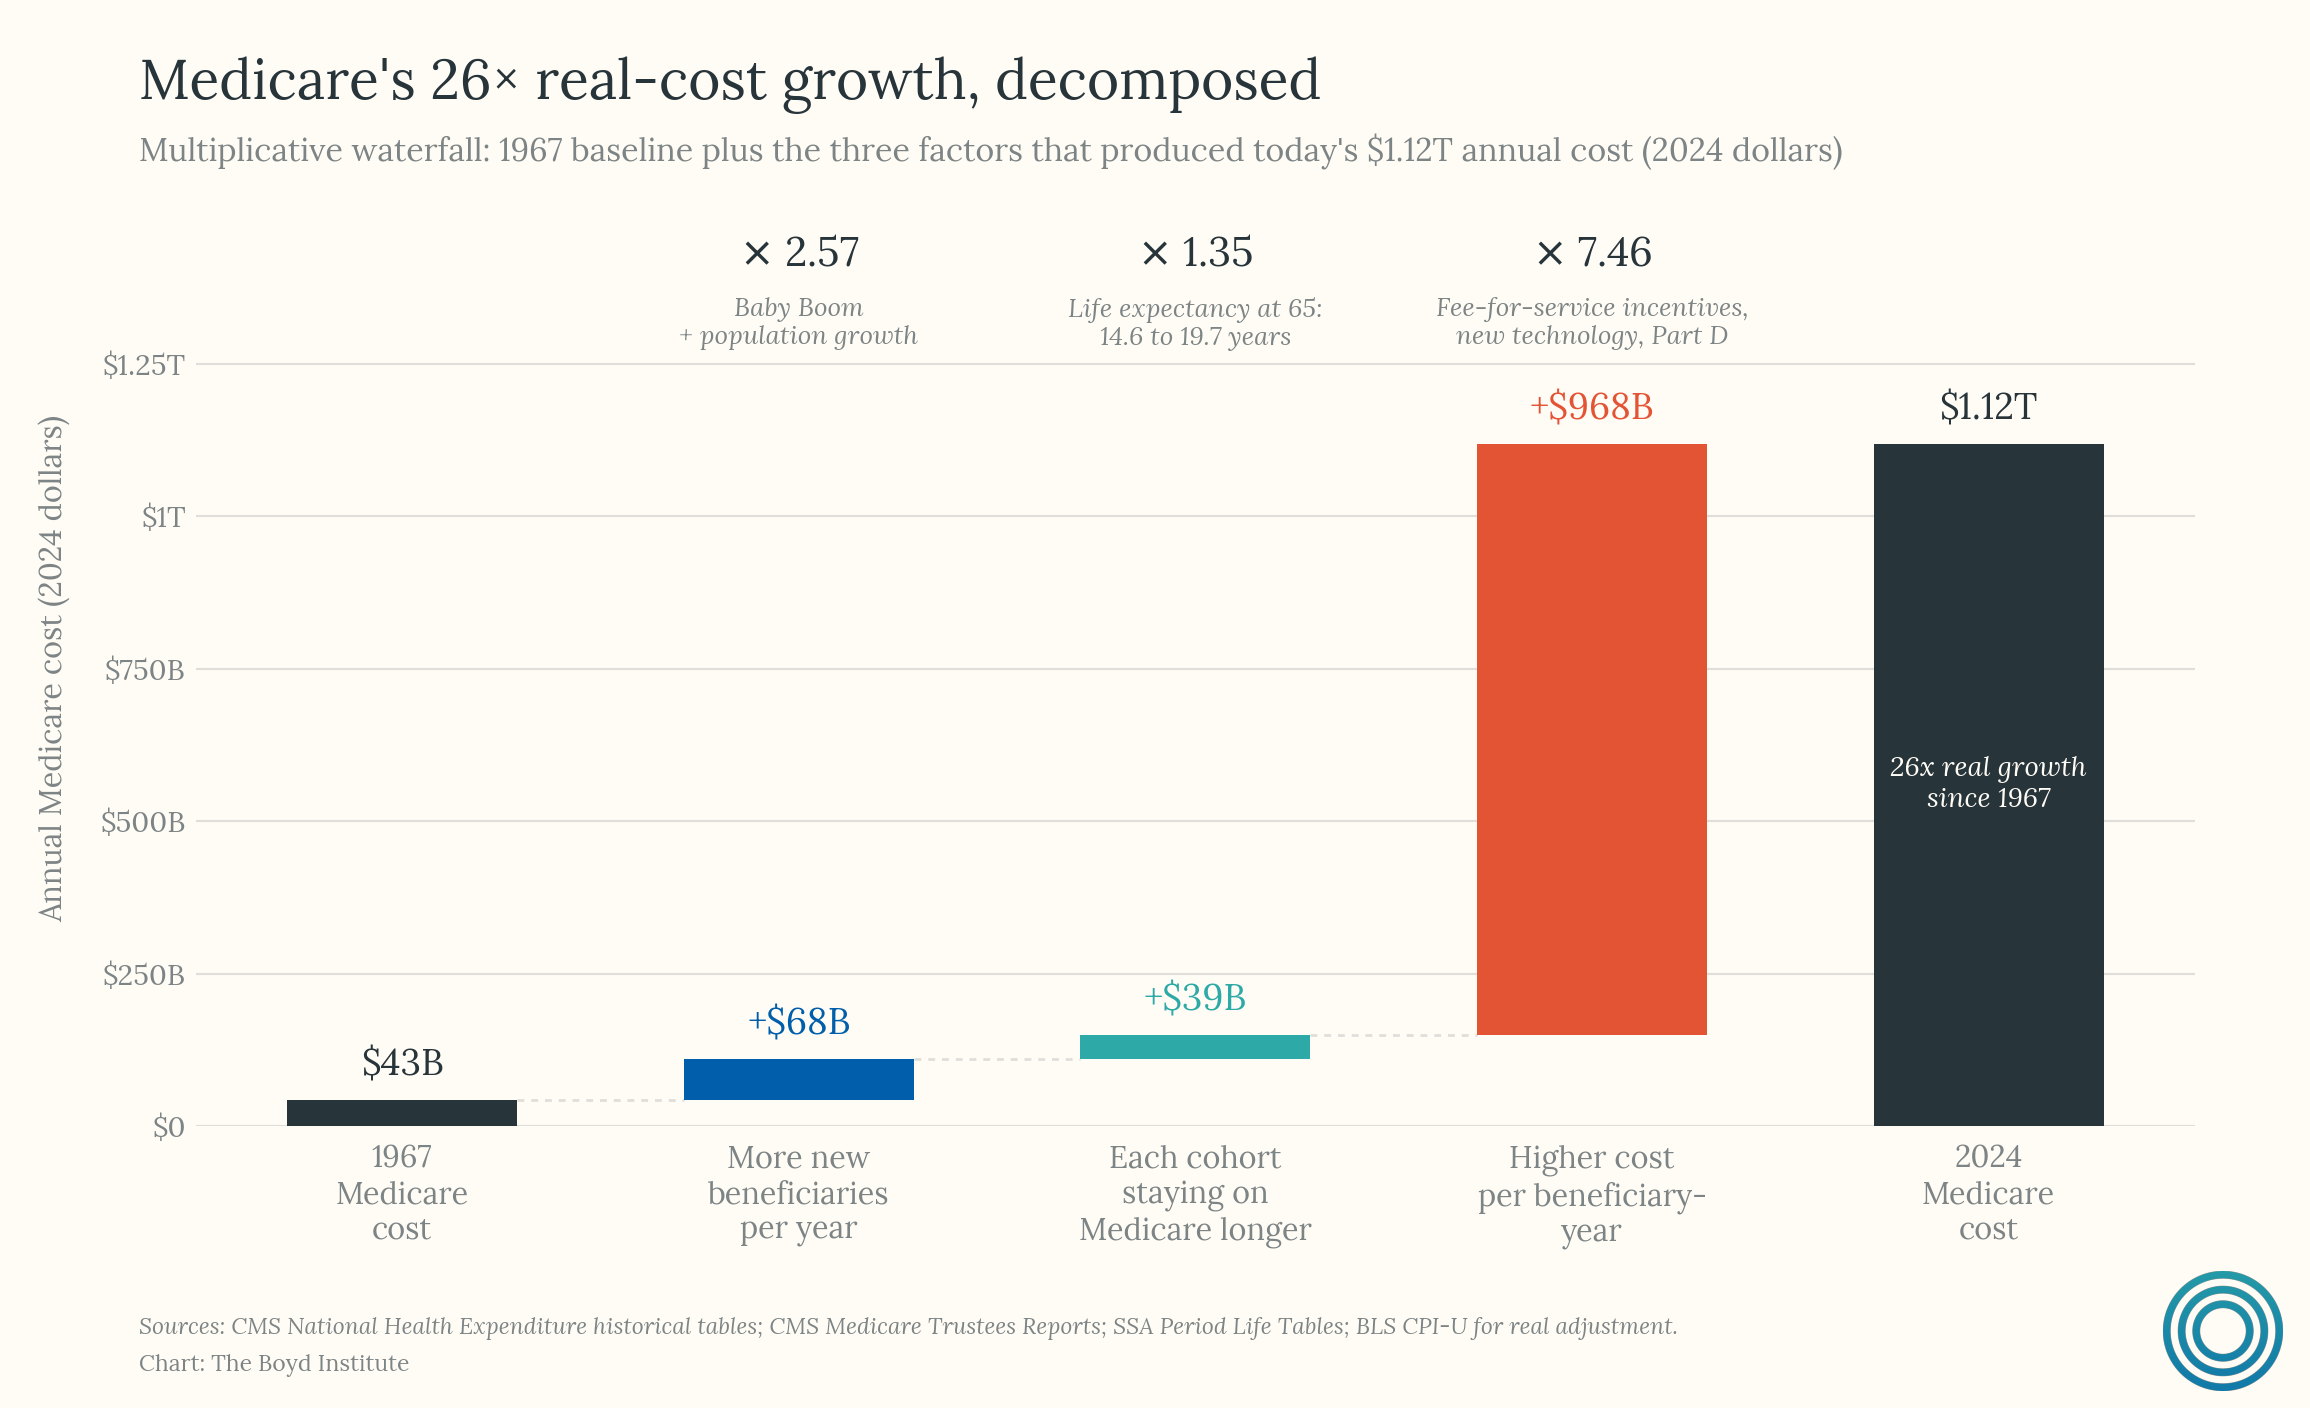
Demographics — more inflow plus longer cohorts — contribute a combined 3.47×. Real cost per beneficiary-year contributes 7.46×. Played out year by year, the architectural factor overwhelmingly swallows the demographic ones.
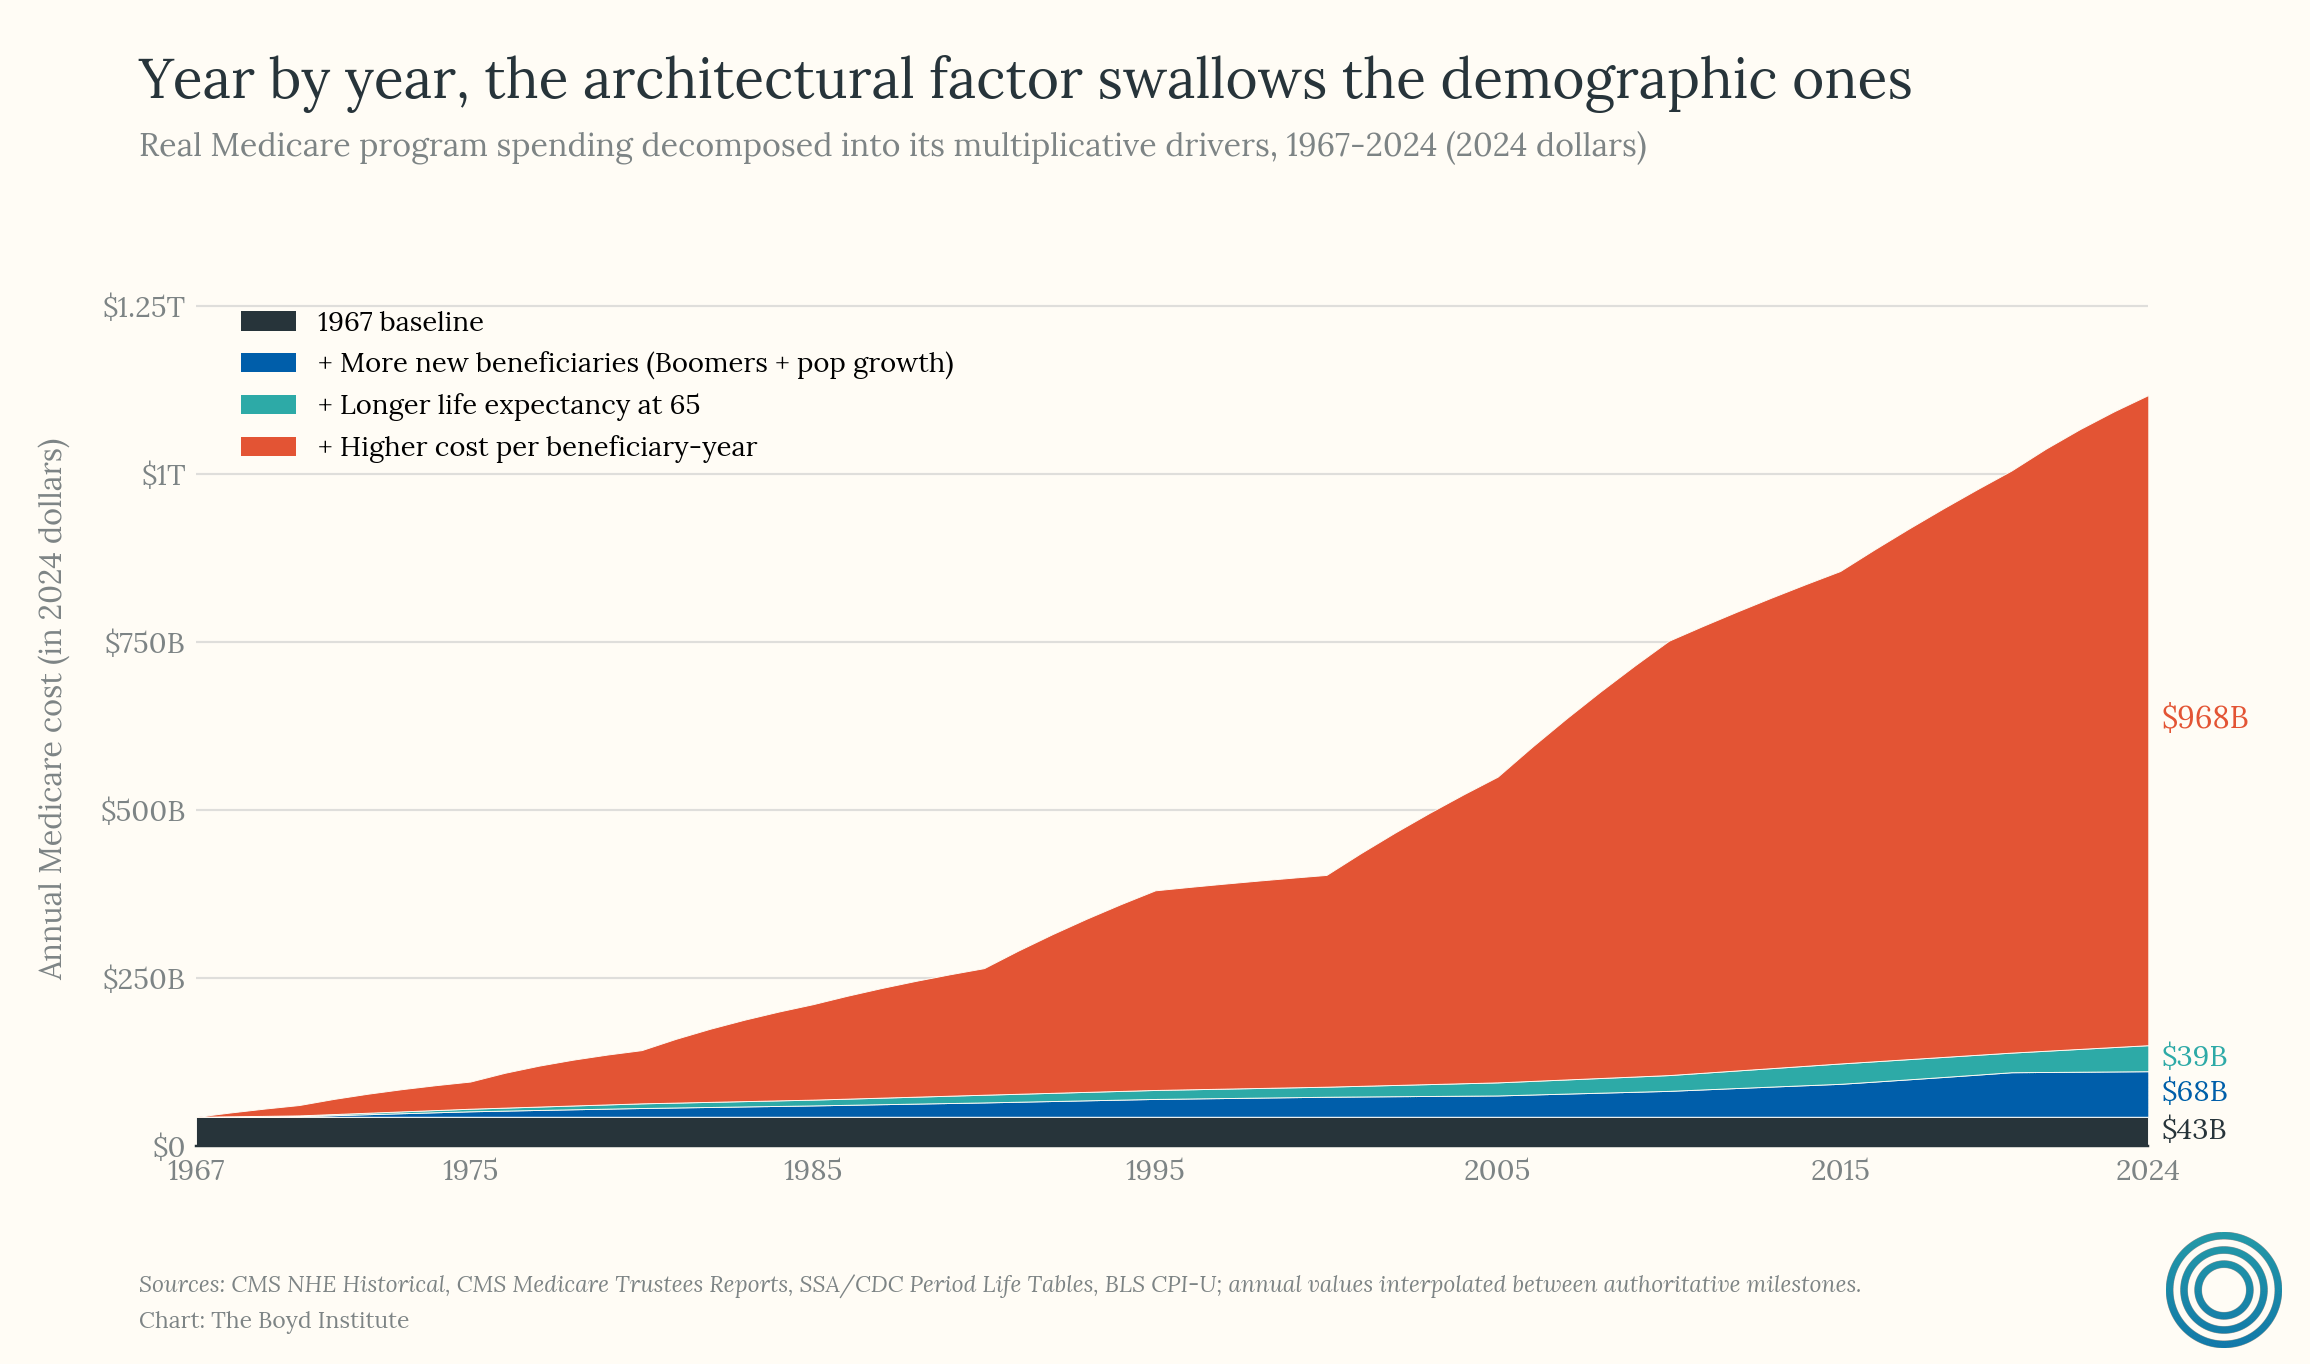
Of the roughly $1.07T in real cost growth above the 1967 baseline, demographics account for about $107B. The other $968B is how much more it now costs to keep one person on Medicare for one year. Three reinforcing dynamics live inside that.
The first is the fee-for-service payment architecture. Medicare’s traditional program pays doctors and hospitals a fixed price for each procedure or service performed. This incentivizes volume — more tests, more visits, more procedures — regardless of whether they improve outcomes. Every time Congress has attempted to implement automatic spending controls, it has simply overridden them. For example, the Sustainable Growth Rate mechanism, created in 1997, required automatic reductions in physician payments when spending exceeded targets. Congress blocked these cuts every single year from 2003 onward, accumulating over $150 billion in additional costs through annual “doc fixes.” The design incentivizes overuse, and the political system refuses to enforce the guardrails.
The second is the steady accumulation of new things to pay for. As we mentioned, part of the expansion in costs include legal expansions in coverage such as Medicare Part D — the prescription drug benefit added in 2006 — which alone costs roughly $130 billion a year, money that didn’t exist as a Medicare line item before. Imaging, biologics, robotic surgery, gene therapies: each new capability, while often adding genuine medical value, adds cost. But the architecture has no built-in way to weigh the new capabilities in cost/benefit terms. The costs just tack on.
The third is fraud at scale, which is best understood not as a separate problem but as the natural output of an open-ended payment system at trillion-dollar scale. HHS estimated over $100 billion in combined Medicare and Medicaid improper payments in fiscal year 2023.6 Jim Chanos has called this “the Golden Age of Fraud” and pointed specifically to Medicare Advantage upcoding as the clearest example. Medicare Advantage pays insurers on a risk-adjusted basis: the sicker your patients look on paper, the more the government pays. MedPAC estimates the federal government pays insurers 20% more for Medicare Advantage enrollees than for similar patients in traditional Medicare — $84 billion in excess payments in 2025 alone, roughly $40 billion attributable to coding differences. Asked why nobody addresses this, Chanos was blunt:
“I don’t know. We have a willingness in the corporate sector and elsewhere, and in the nexus of government and corporate, of just not holding people to account.”
Fraud on this scale is a symptom, with the fee-for-service model being an invitation to overbill, and the “pay-and-chase” enforcement model meaning that fraud is detected only after the money is already out the door. Moreover, the sheer size of the program — well over a trillion dollars annually — means even a “small” fraud rate translates into tens of billions.7
Fixing Medicare fraud would not close the deficit. But the fraud illuminates the deeper dysfunction: a mid-century program architecture that cannot operate at 21st-century scale without hemorrhaging money.
Part IV: Dollar Dominance — Why It Matters, and Why It Hasn’t Blown Up Yet
11) The dollar’s value is only indirectly related to US debt levels.
After ten ground truths’ worth of fiscal pathology, the natural question is: if it’s this bad, why hasn’t the dollar collapsed? It’s a fair question, and the popular answer — that deficits mechanically weaken the currency — happens to be wrong. Understanding why requires understanding the actual basis of dollar strength.
The empirical record makes the point immediately. Over the last two decades, federal debt has roughly doubled as a share of GDP, while the trade-weighted dollar index has simultaneously appreciated.
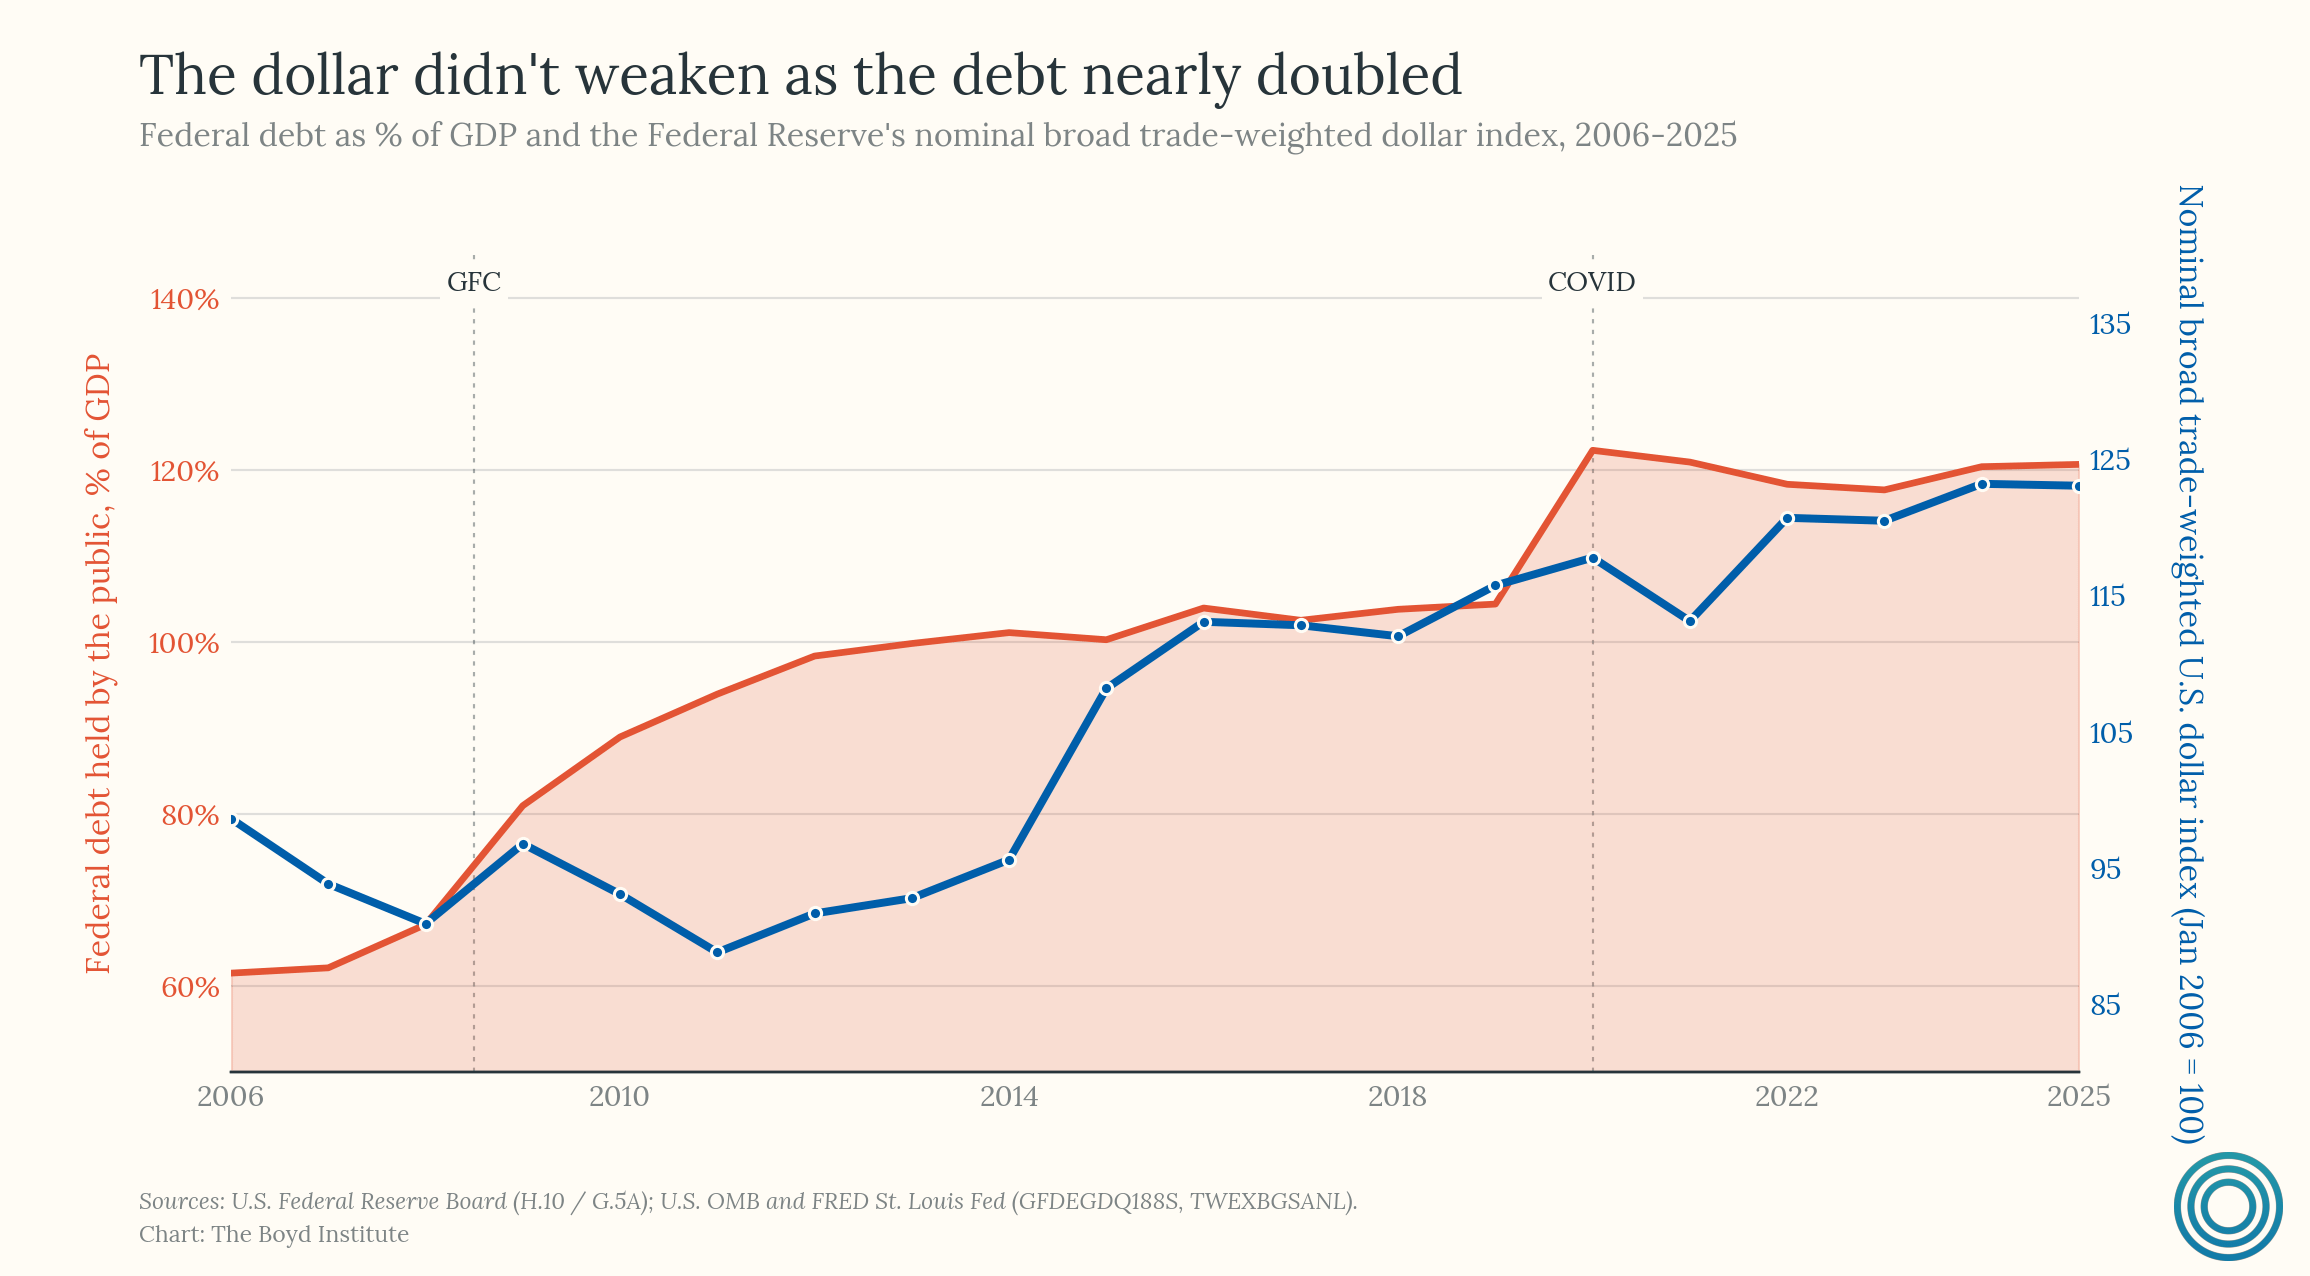
That the dollar's value has risen in tandem with ballooning debt is evidence that its value, at least in part, rests on a stack of institutional advantages that have very little to do with the US fiscal outlook.
The US has the deepest, most liquid capital markets on earth — the US Treasury market alone is over $28 trillion, roughly an order of magnitude larger than its nearest competitor. It has property rights and legal recourse for investors that no other major economy can credibly match — if you hold a US asset and there is a dispute, you can be confident that a court will uphold your claim. It has a central bank that, despite political pressure, has continued to optimize for its dual mandate rather than the political calendar. And finally, a point that many people overlook is that the US’ private sector is among the most dynamic of any developed nation. If you are a global equity investor, your largest allocation is more likely than not in US stocks. The same goes for US corporate paper.
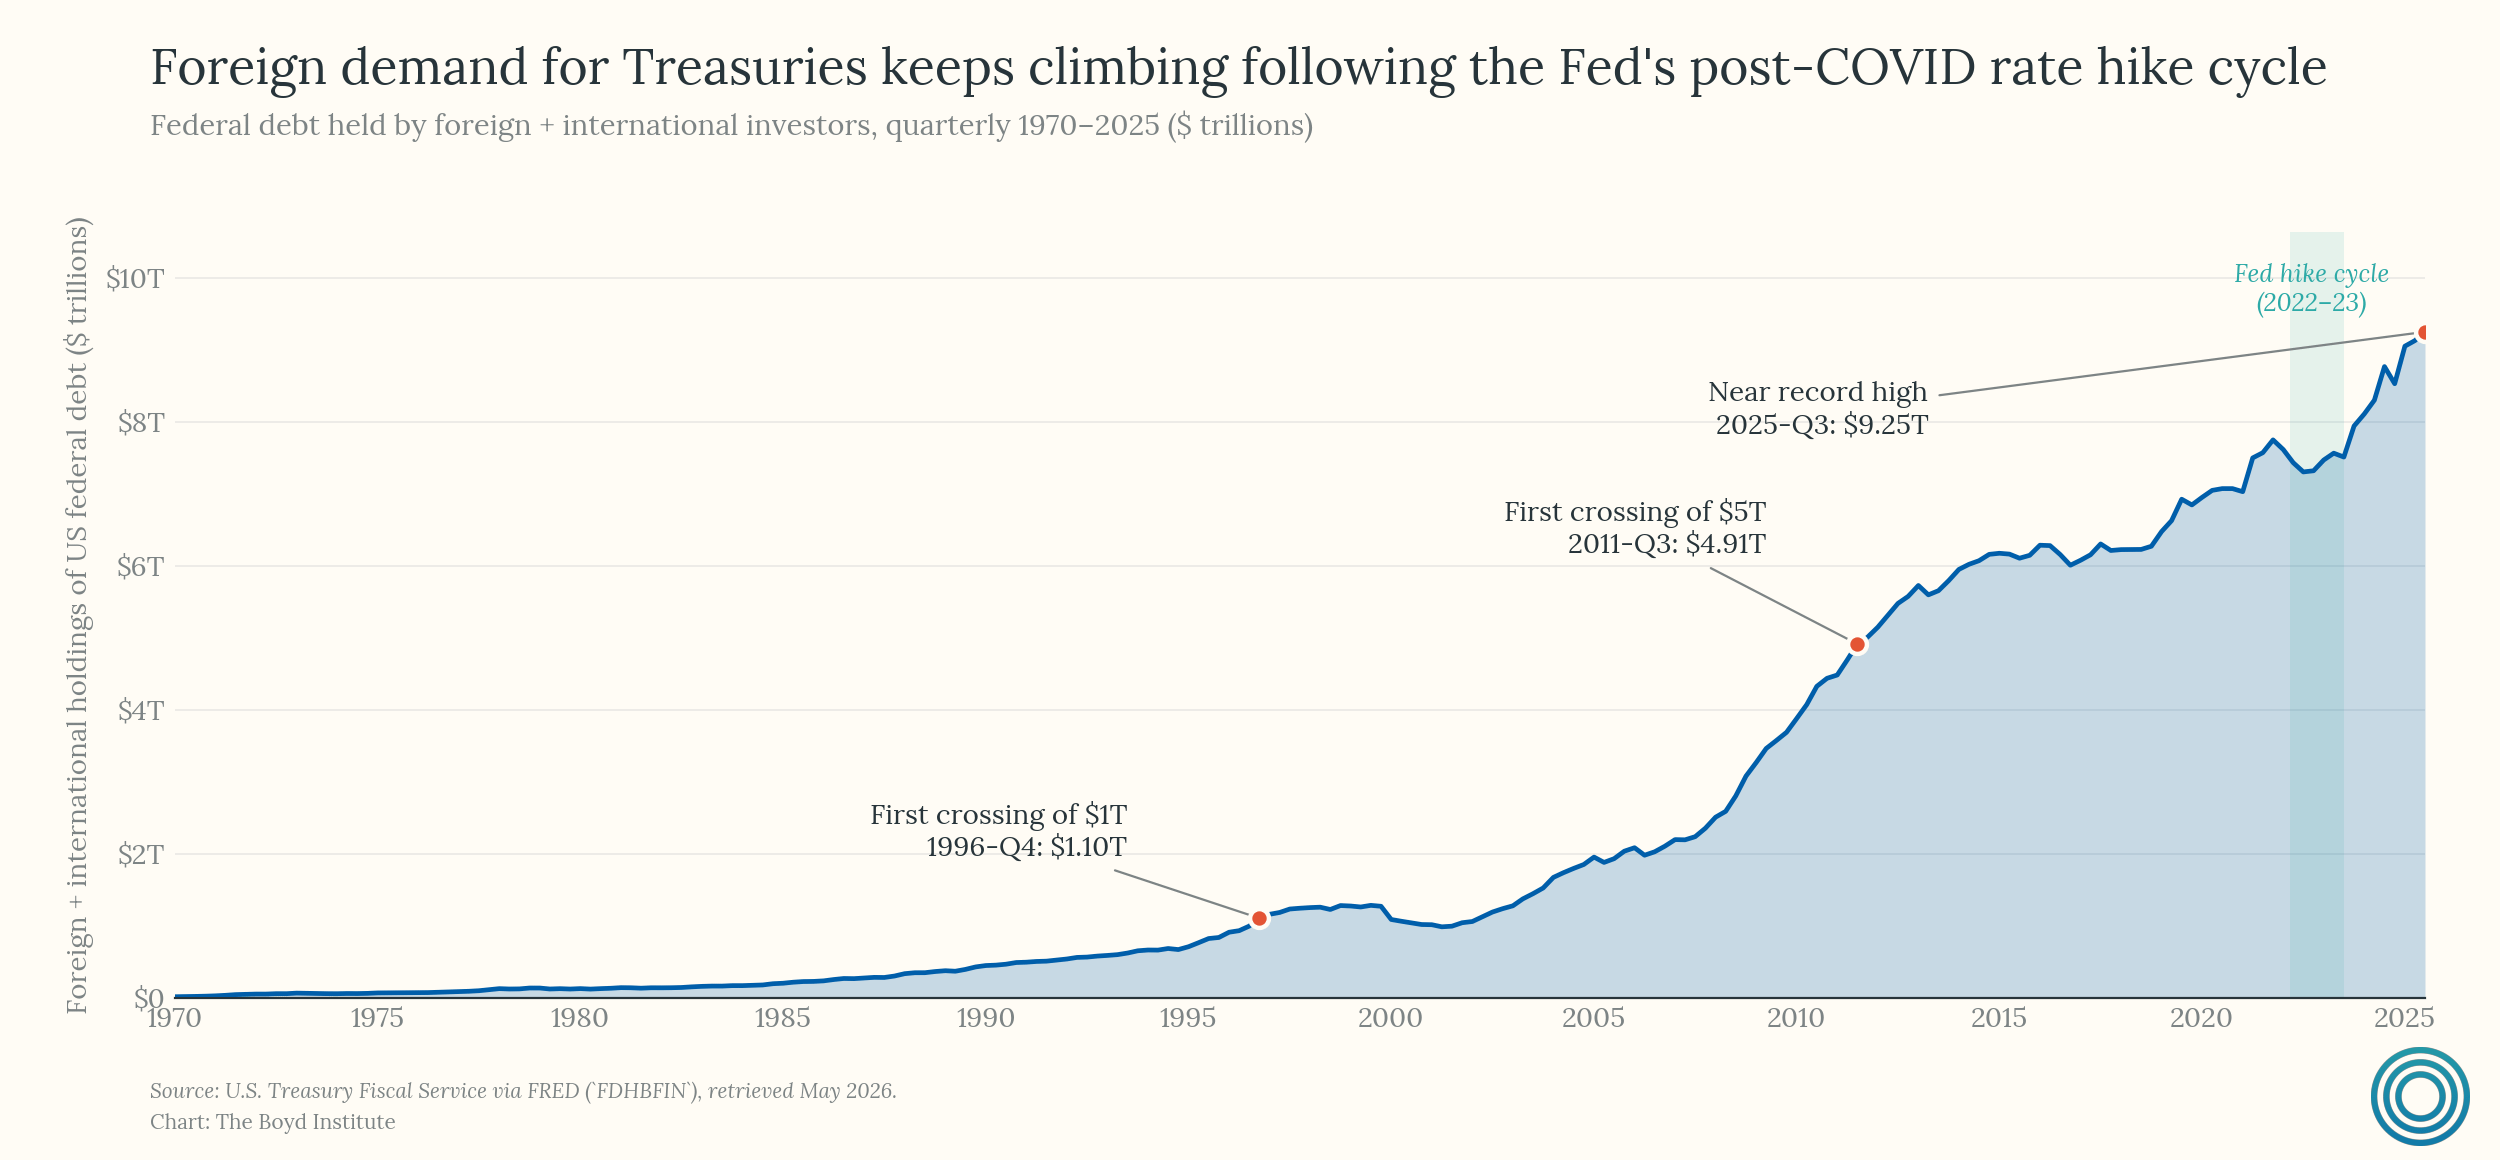
It is then no wonder why, even in the face of a cascading fiscal imbalance, that foreign demand for dollar-denominated assets continues reaching new highs:
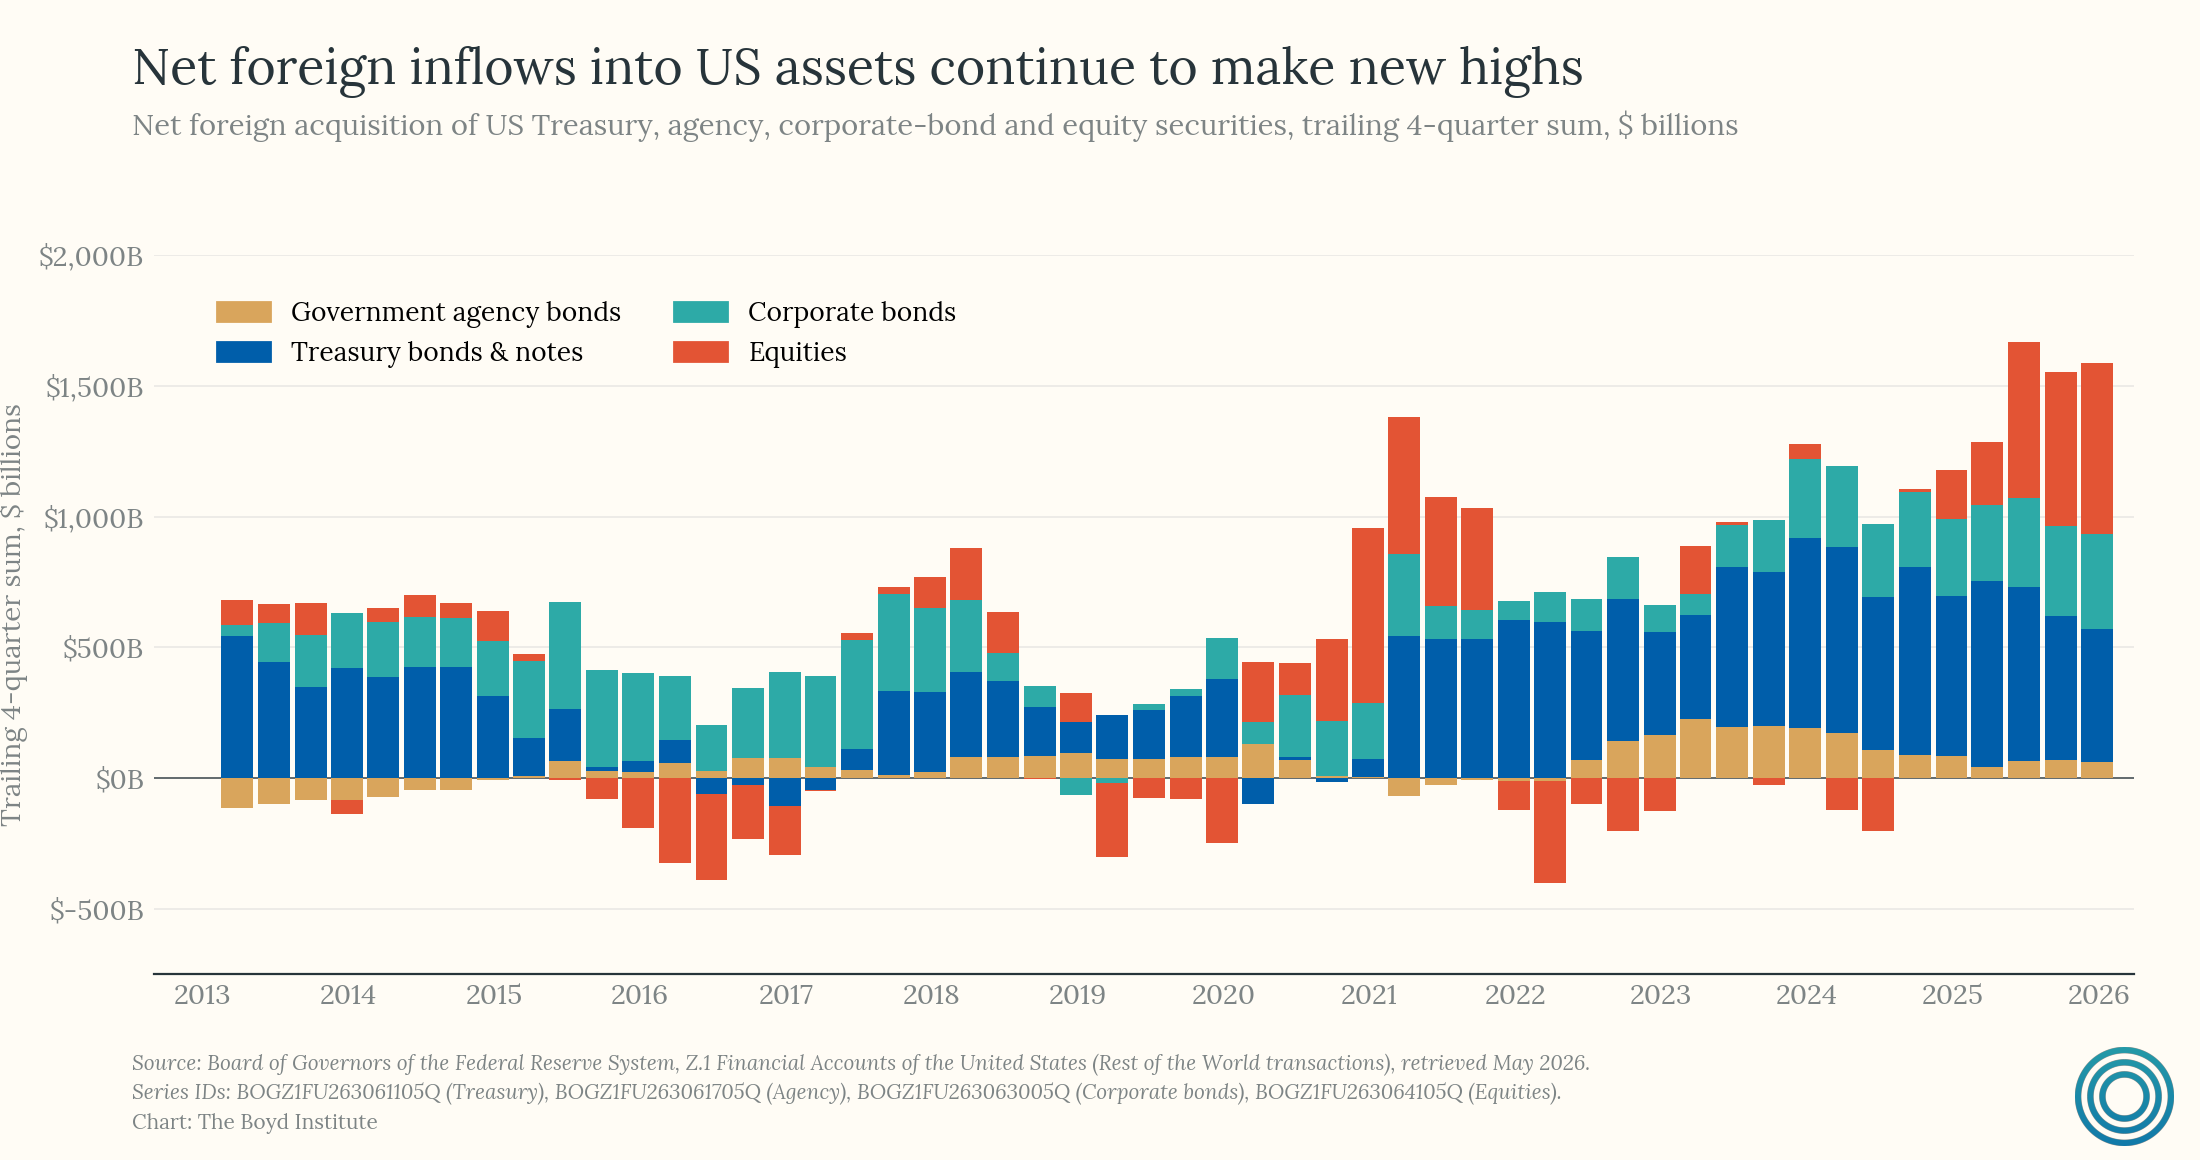
These institutional fundamentals are what global asset allocators are actually weighing when they choose to hold dollars or dollar-denominated assets. The deficit matters to the extent that it threatens those fundamentals over time — through inflationary erosion, institutional degradation, or loss of Fed credibility — but the relationship is indirect and operates on long horizons.
The alternatives reinforce the point. The euro has no fiscal union behind it. The yuan has extensive capital controls and an arbitrary rule of law. The ruble is not a serious candidate. The yen — historically a safe-haven currency — is now, after decades of fiscal expansion and ultra-loose monetary policy, experiencing unprecedented volatility against the dollar. And cryptocurrency cannot settle the $7.5 trillion in daily global FX volume that the dollar handles by default.
Every alternative to the dollar has structural deficiencies that make it unsuitable as a reserve currency at scale. Now, dollar dominance was partly the product of historical luck — the US not being a WWII battleground, Bretton Woods first-mover advantage, etc. — and what was constructed can be deconstructed. But monetary power changes hands over centuries, not election cycles.
It is also worth noting that the dollar's current position reflects trust that has been hard-won. In the early 1970s, Richard Nixon pressured Fed Chair Arthur Burns to maintain loose monetary policy ahead of the 1972 election, contributing to the stagflation of that decade. Restoring credibility required Paul Volcker's painful rate hikes in the early 1980s. Today, despite occasional political noise — including jawboning from the White House — Fed independence holds. But that credibility is a depletable asset, not a permanent feature of the landscape.
12) The dollar’s reserve status also looks a lot like a proof-of-violence mechanism.
The institutional story told above is true but incomplete. Beneath property rights, central bank independence, and deep capital markets sits something more elemental: the US controls a remarkable share of the physical and financial infrastructure through which global commerce moves, and the dollar’s value likely reflects that control.
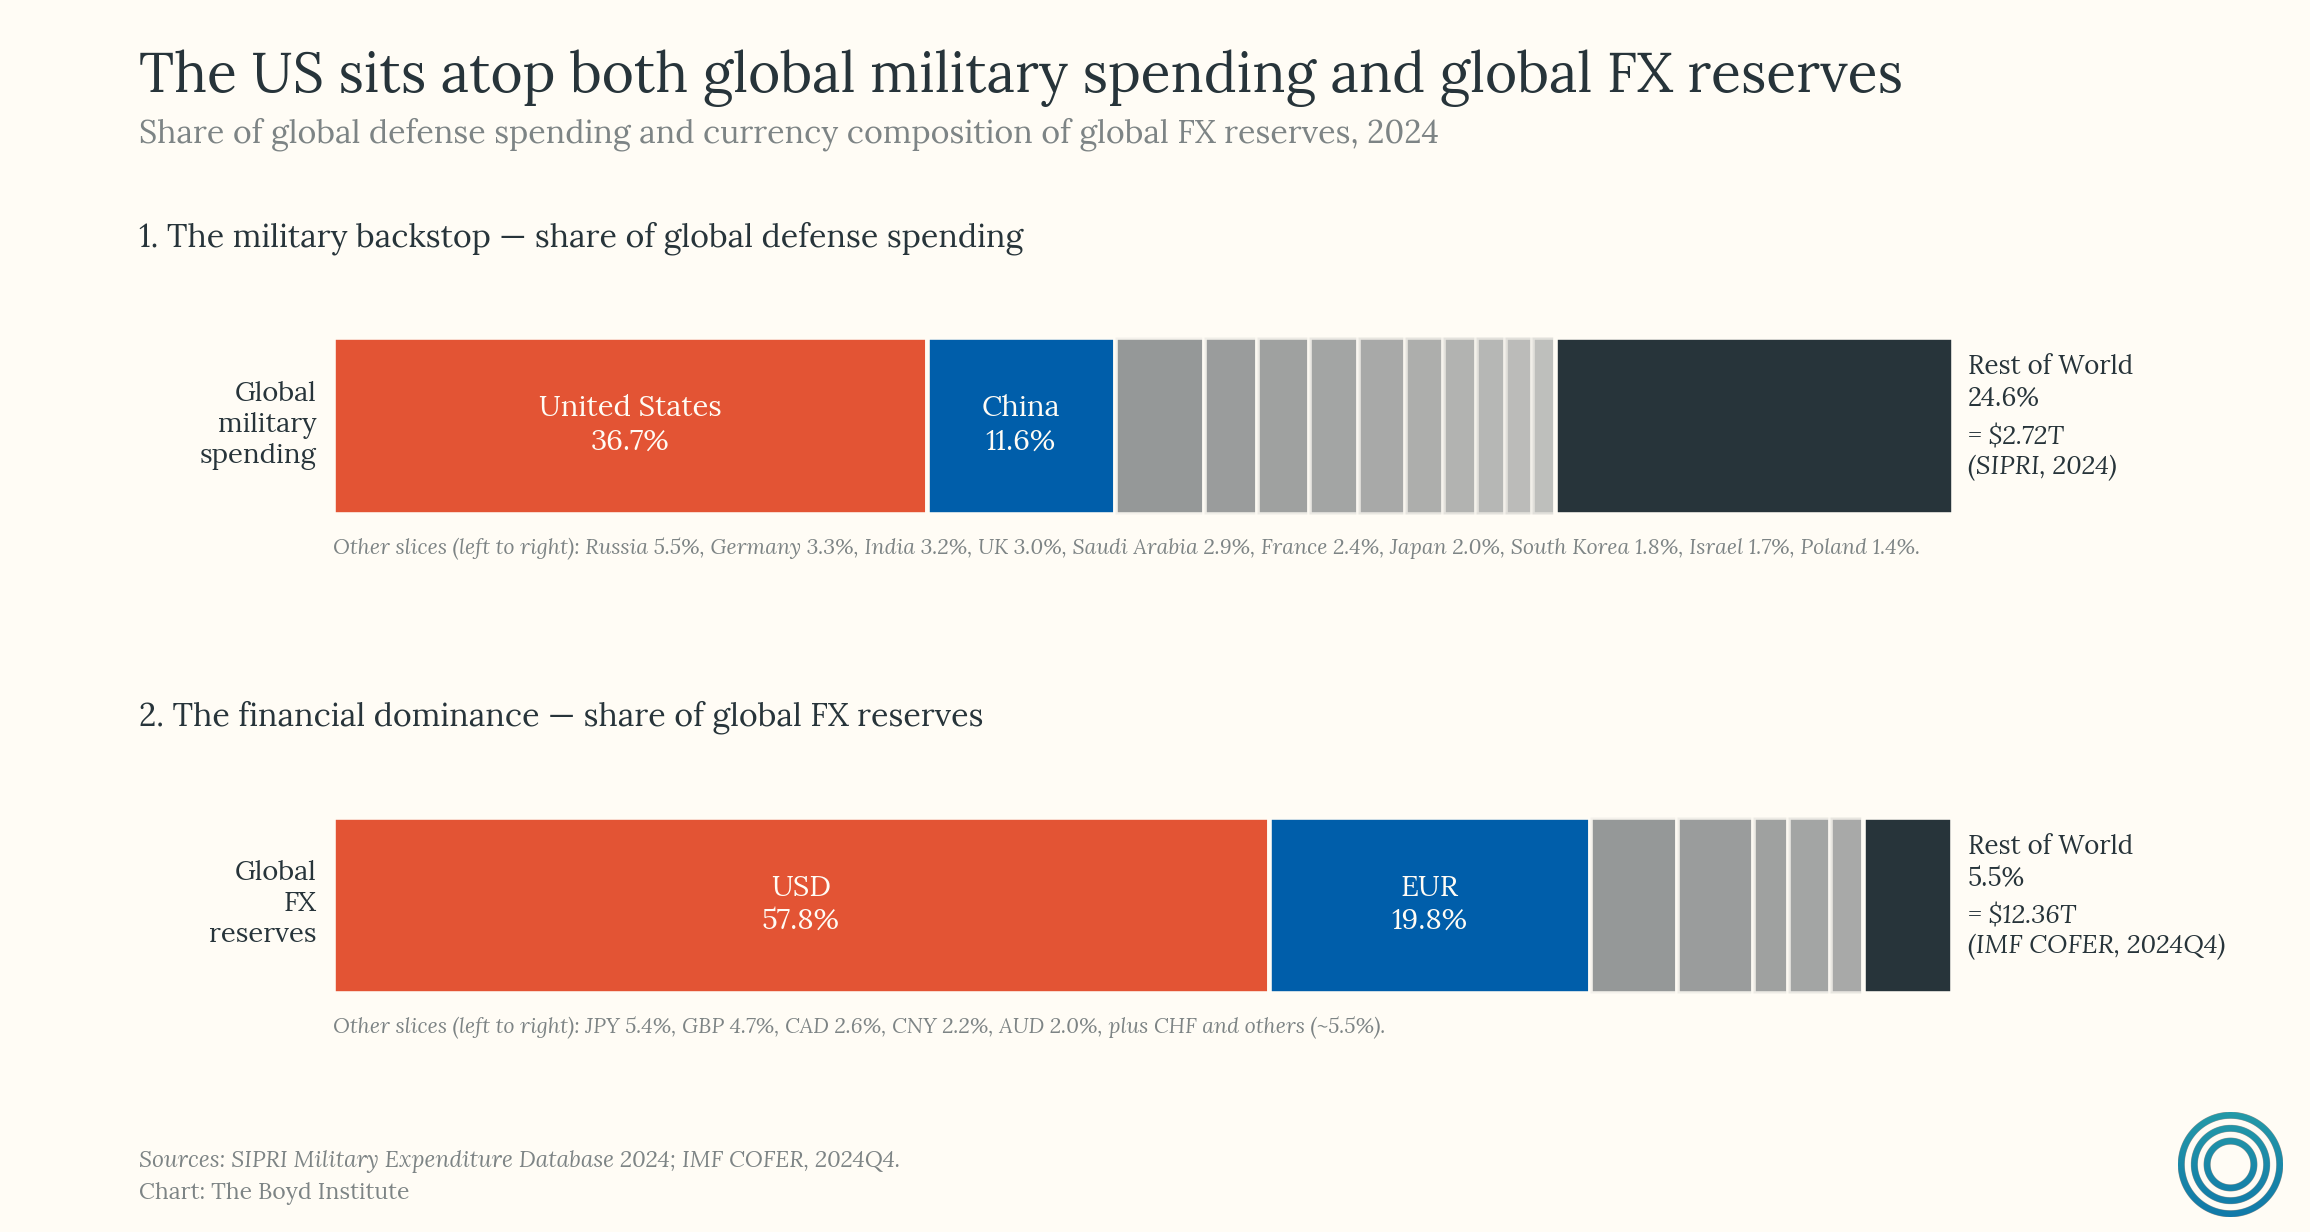
The juxtaposition is suggestive: the US accounts for 36.7% of global military spending, while the dollar accounts for 57.8% of allocated FX reserves. That doesn’t prove causation, but it does show the same state sitting atop both the hard-power and monetary hierarchies — consistent with the idea that reserve status is partly secured, not just admired.
That relationship becomes more concrete when you look at the map. All ten major maritime chokepoints on the chart sit within operational range of a US fleet, and the four largest — Hormuz8, Malacca, the South China Sea, and Suez — together carry roughly three-quarters of global seaborne trade. Add Bab el-Mandeb, Gibraltar, and Panama, and you are looking at the arteries of the world economy.

American bases and fleets underwrite the movement of energy, manufactures, and commodities through the narrow passages on which global trade depends. The US’ largest trade partners — Europe, Japan, South Korea, the Gulf states — are also the countries that benefit most from the American security umbrella. The monetary relationship and the security relationship are, in that sense, two expressions of the same underlying arrangement: the US provides order, and the world holds dollars.9
Then there is the financial infrastructure layer. In trade finance, 80.7% of SWIFT — the Belgium-based financial network underpinning much of the world’s cross-border banking activity — messaging value is dollar-denominated.
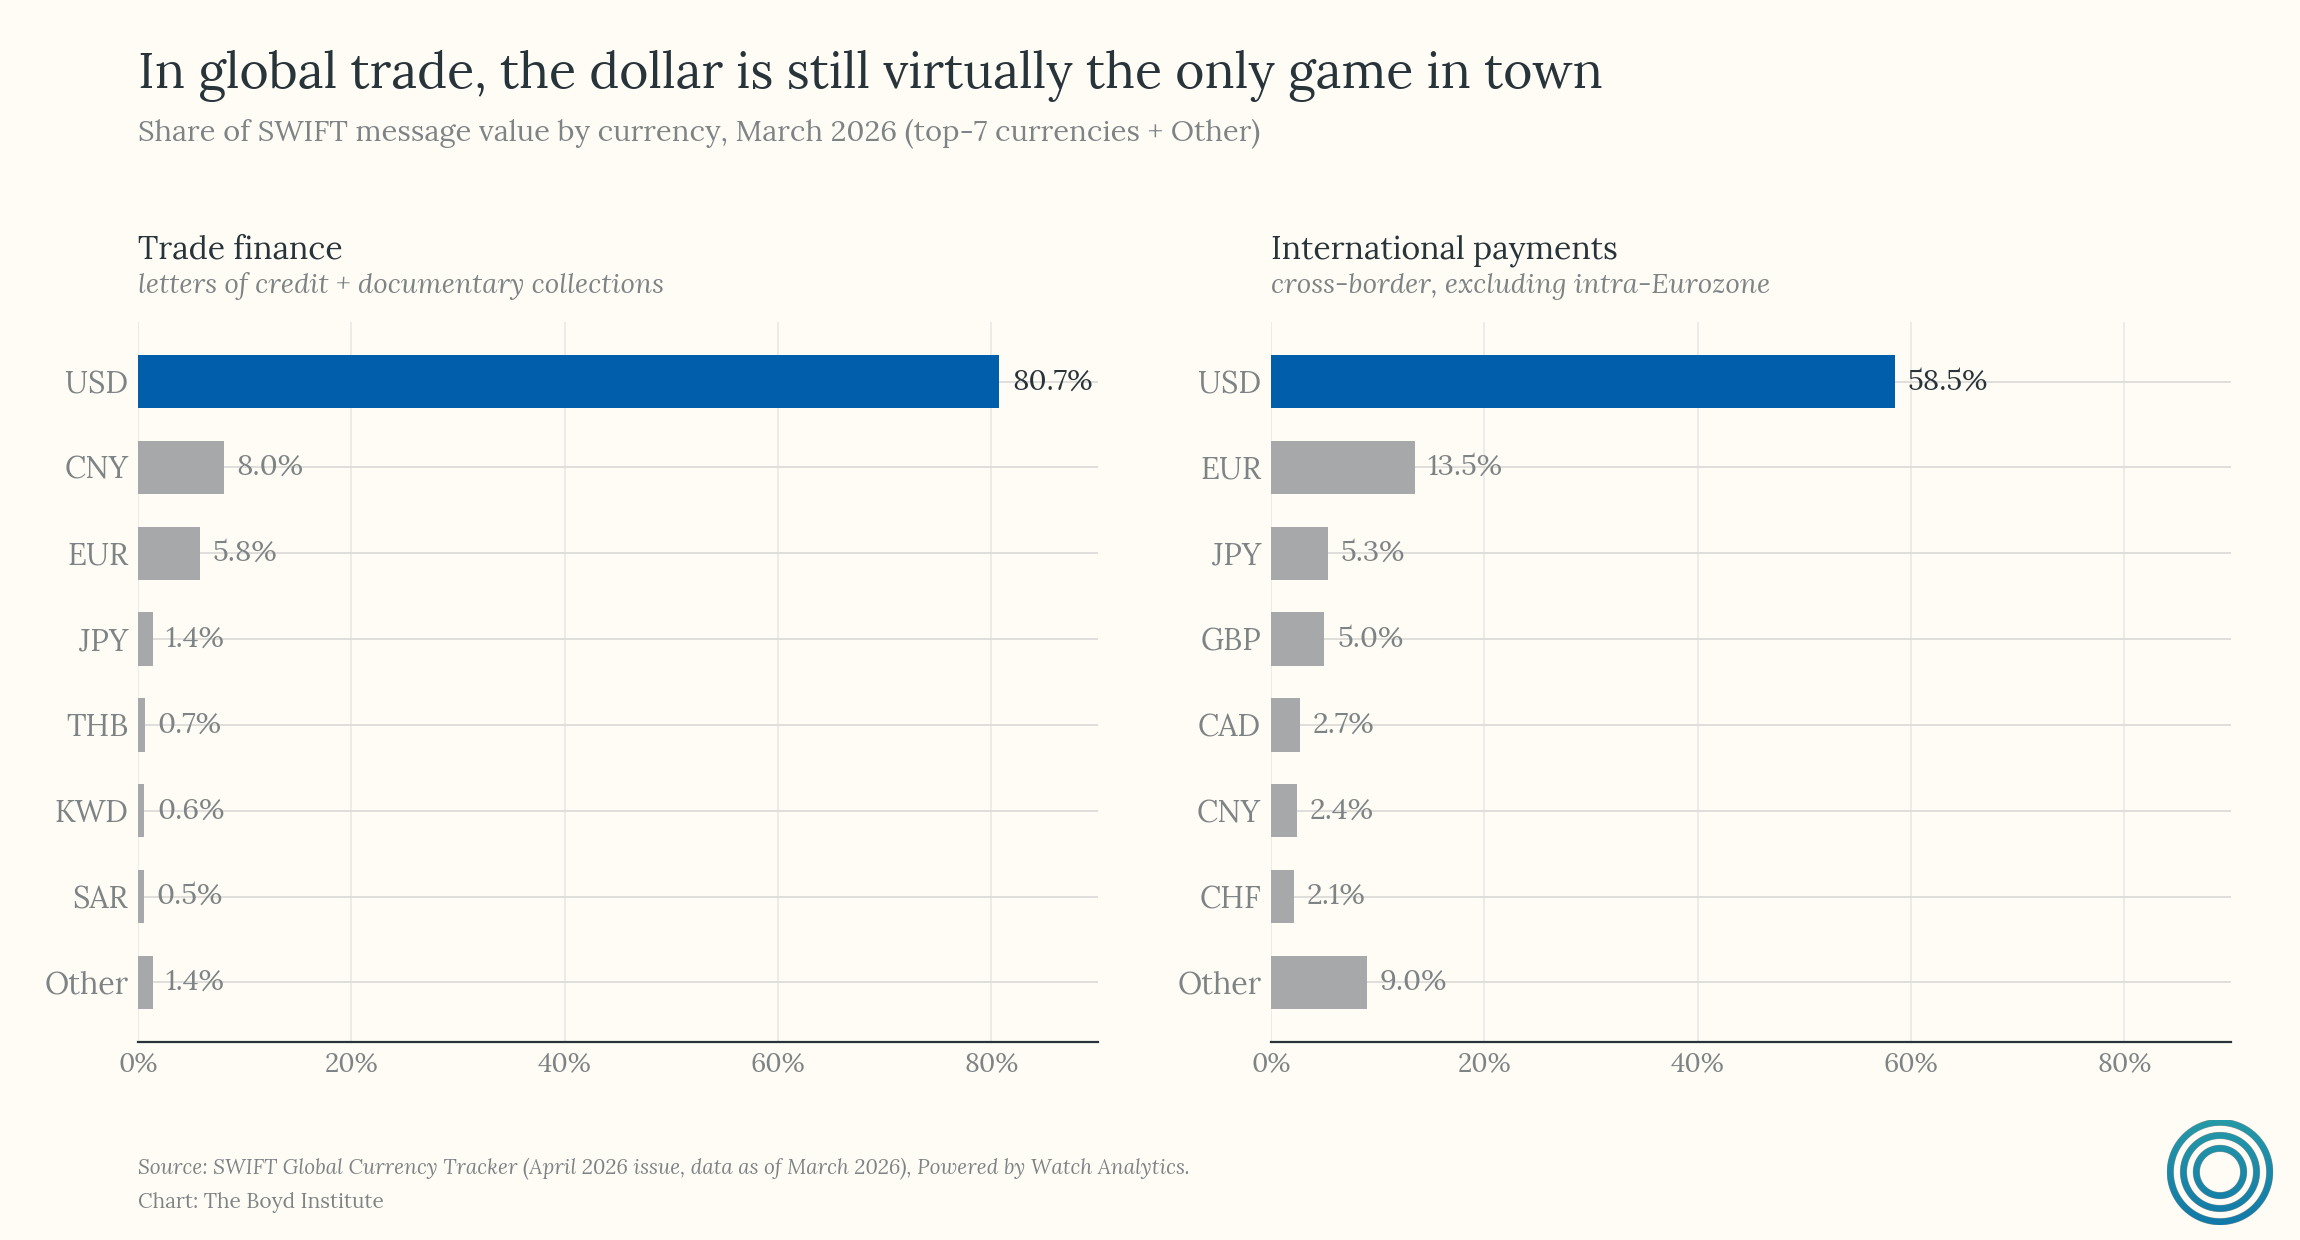
Iran was disconnected from SWIFT under US sanctions pressure; many major Russian banks were removed after the 2022 invasion of Ukraine. In practice, the ability to cut states off from global financial infrastructure functions as a powerful form of economic coercion that can, in many contexts, rival traditional military force in geopolitical significance. The dollar’s reserve status, in this light, functions as a kind of “proof of violence” — analogous to the “proof of work” that underpins cryptocurrency — grounded in physical and institutional coercive capacity. The currency is thus valuable because it is backed by the demonstrated ability to enforce the rules of the system it currently denominates.
This loops directly back to the Ferguson threshold in ground truth number one. If the dollar’s reserve status is ultimately backstopped by America’s capacity to project force, then the moment debt service begins crowding out the defense budget, the collateral that makes the debt serviceable becomes cannibalized — liquidated to service the loan. That is the real feedback loop, and it is more dangerous than any debt-to-GDP ratio considered in isolation.
13) Other major currencies are effectively dollar derivatives.
In 1971, then-Treasury Secretary John Connally told a room of European finance ministers:
“The dollar is our currency, but it’s your problem.”
It was a provocation then, delivered in the chaotic aftermath of the Nixon Shock — the unilateral suspension of the dollar’s convertibility to gold. Half a century later, it has become a structural description of the international monetary system.
The degree of global dependence on the dollar today dwarfs anything Connally could have imagined. After the Global Financial Crisis, the Federal Reserve became the de facto backstop for other central banks, extending dollar swap lines in moments of crisis and functioning as the lender of last resort for the global financial system. The system would seize without dollar liquidity that only the Fed could provide.
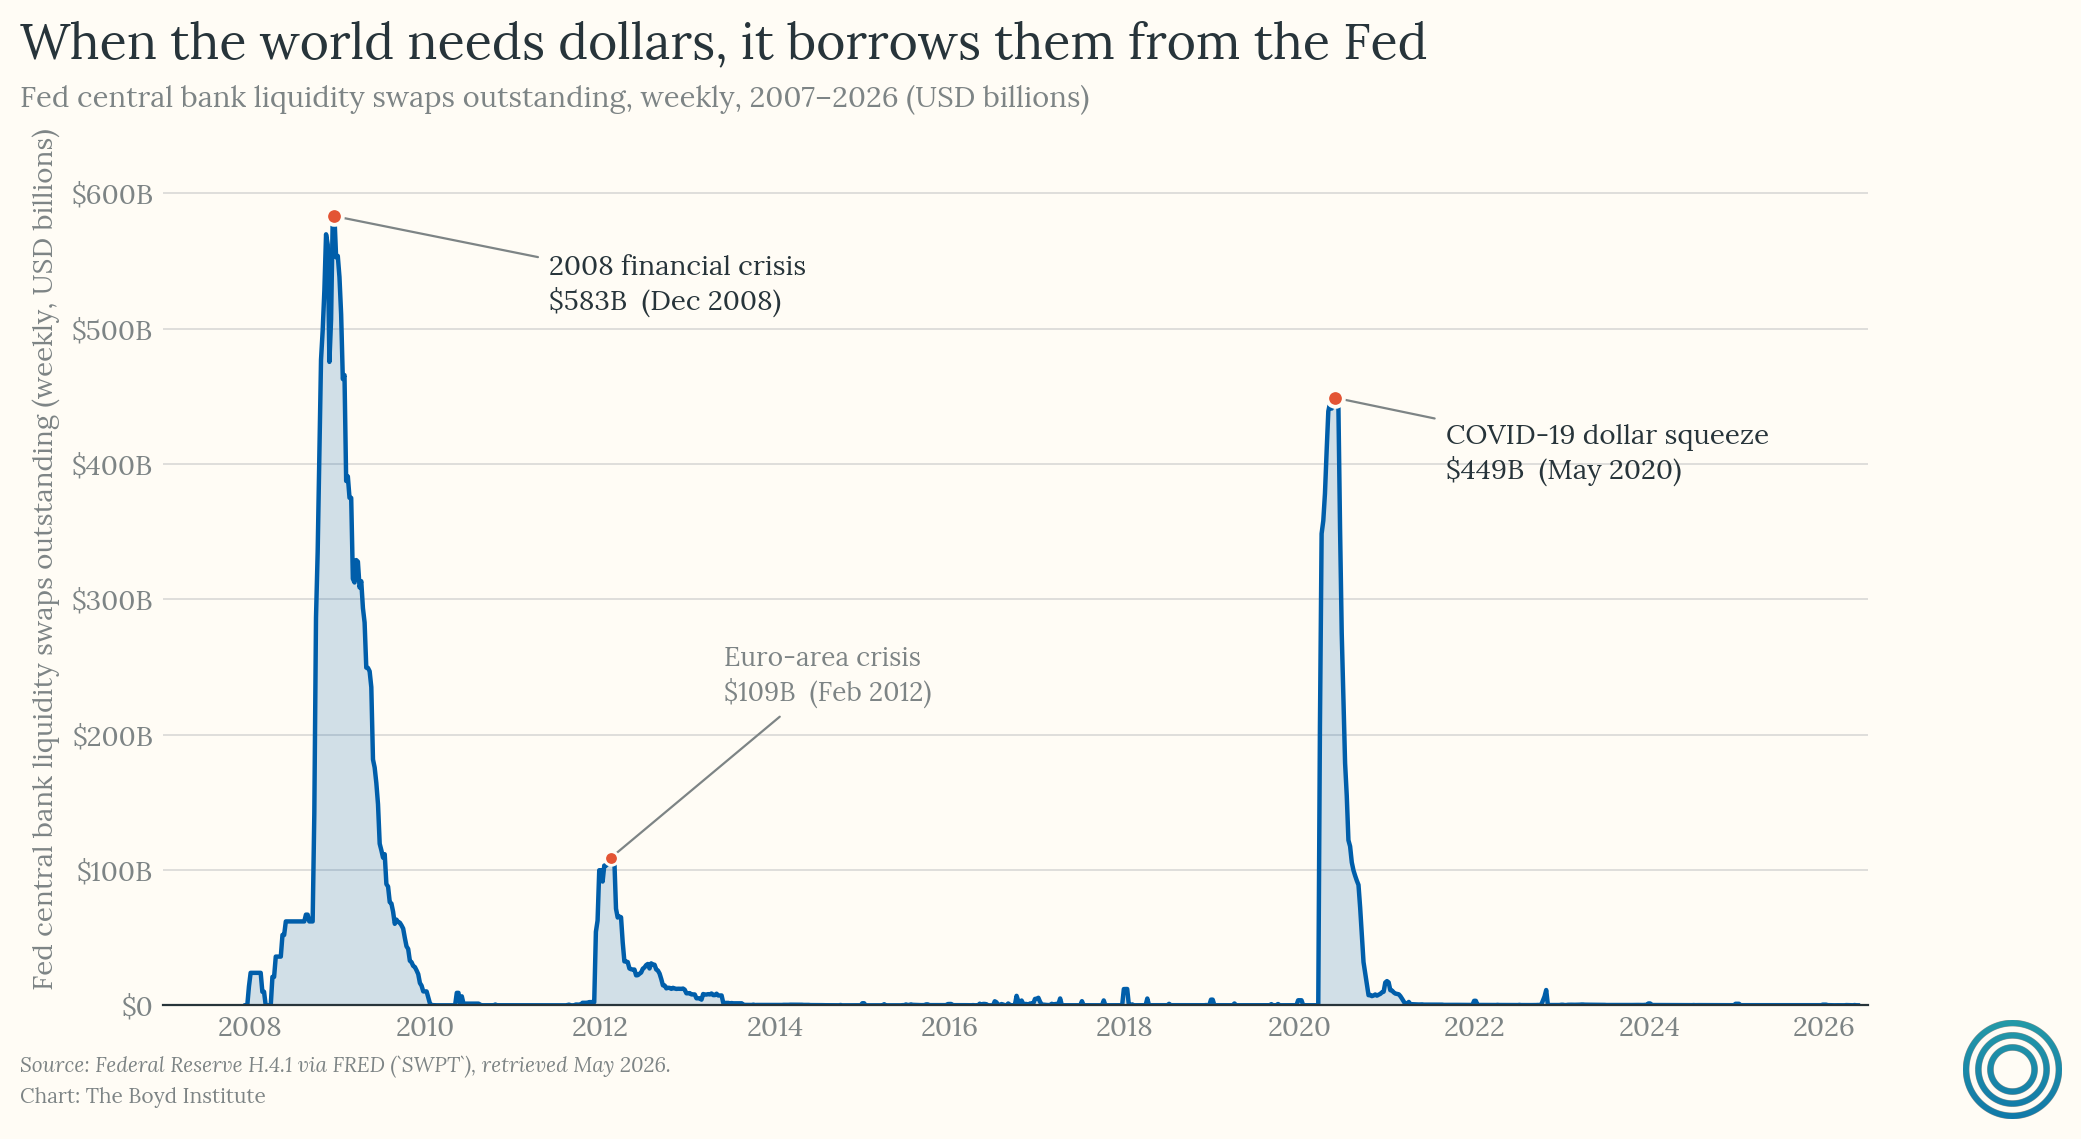
The result is not coordination among equals. It is a hub-and-spoke system in which the hub has a monopoly on the thing everyone needs. When the Fed moves, the ECB and the Bank of Japan must respond — whether they want to or not — because capital flows respect yield differentials and risk premiums, not central bank sovereignty in isolation. Indeed, the ECB and BOJ calibrate their entire monetary transmission mechanisms to a world in which the Fed provides dollar liquidity in crises, as their banks hold massive dollar-denominated assets.
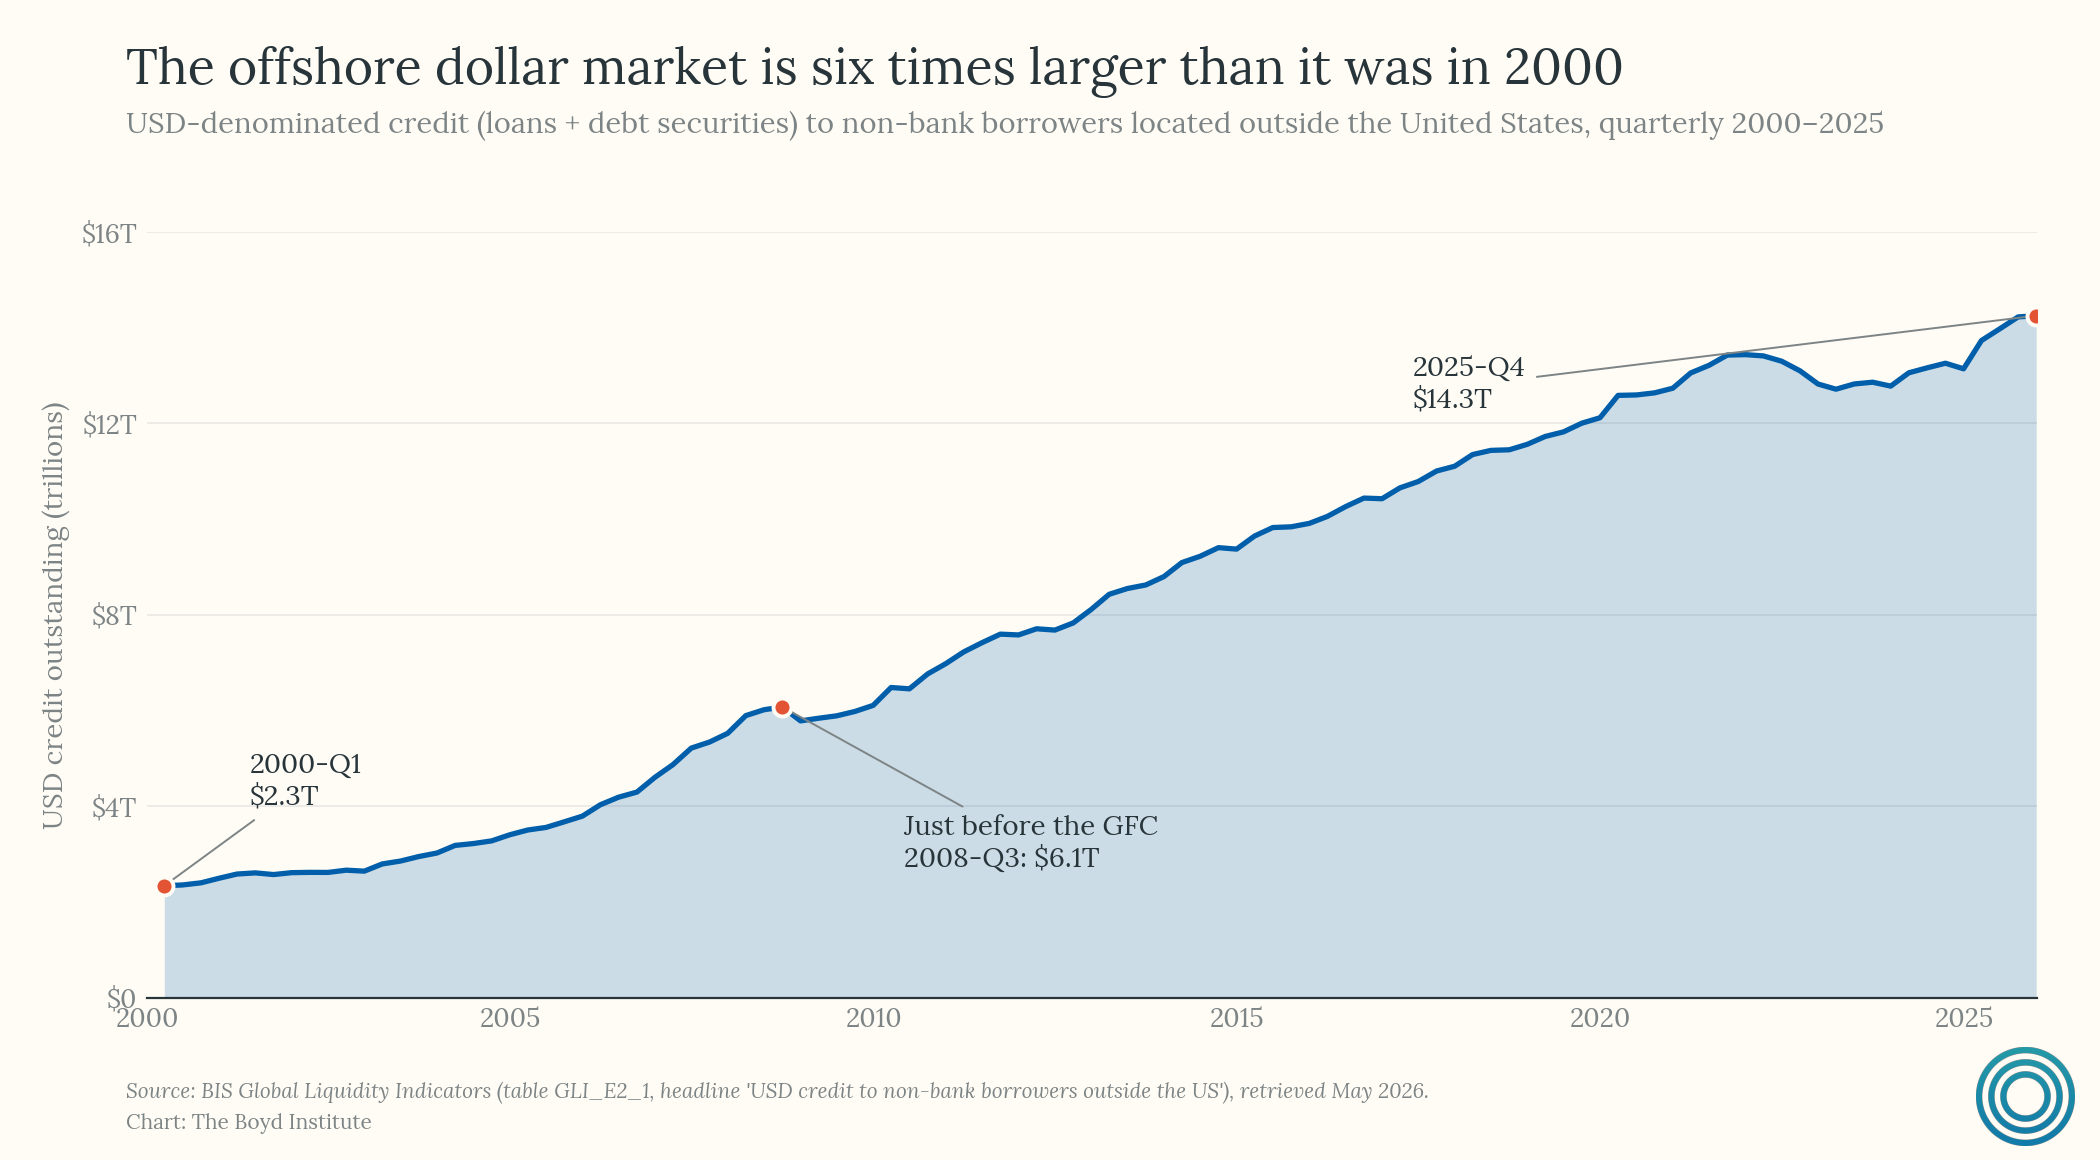
The scale of that calibration is itself the proof. Foreign banks hold trillions in cross-border dollar liabilities to other foreign banks — debts that only the Fed can ultimately produce. Thus other major currencies are, in a meaningful sense, dollar derivatives: their value, their policy space, and their crisis-response capacity are all functions of what the Fed does.
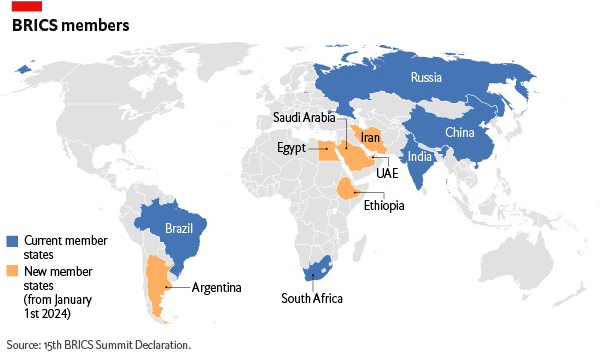
This creates a dynamic of mutual assured destruction. If your entire balance sheet is calibrated to dollar dominance, the dollar's collapse is not a liberation — it is a catastrophe. You cannot root for de-dollarization without rooting for the destruction of your own financial system. That is why BRICS rhetoric about alternative reserve currencies never materializes into anything structurally meaningful: the switching costs are existential, and you cannot rebuild the plumbing of global finance without the cooperation of the country whose plumbing you are trying to replace.10
Even the most aggressive de-dollarization scenarios concede the point. A 2024 CFA Institute survey found 63% of members expect erosion within 5 to 15 years — but most envision a multipolar outcome, not displacement. Former IMF Chief Ken Rogoff himself, in his 2025 book Our Dollar, Your Problem, articulates his envisioning of the dollar remaining dominant in the Americas, the euro in Europe, the renminbi in Asia. So the change everyone predicts is gradual and partial — which is what entanglement, not collapse, looks like.
For now, and for the foreseeable future, that entanglement is too deep to unwind without mutual destruction.
14) Rising interest rates create their own demand — but only so long as we don’t squander the trust behind it.
There is one final mechanism working in America’s favor that rarely gets discussed ouside of international trade & finance textbooks. As interest rates rise in the US relative to other developed sovereigns, the dollar becomes more attractive to global capital. Through interest rate parity11, the yield advantage pulls capital inward, supporting the dollar even as the underlying fiscal picture deteriorates. The very thing that makes the debt more expensive to service also makes the currency more attractive to hold.
This is a genuine structural advantage that distinguishes the US from any other highly indebted sovereign. Argentina cannot run this play. Italy cannot run this play. The US can, because the dollar’s institutional and coercive advantages make Treasuries the ultimate safe asset in a world that has no real alternative. Rising yields attract the very capital that finances the deficits that produce the yields. It is, in a meaningful sense, self-reinforcing — and it helps explain why the fiscal situation has not yet produced the crisis that its scale might lead one to expect.
But the “only so long as” in this ground truth is doing all the work. Interest rate parity functions only in a world where global capital believes the US will honor the implicit contract: stable institutions, an independent central bank, rule of law, no expropriation-by-inflation. The mechanism is trust-dependent, and it operates in an environment where that trust is being slowly drawn down.
The most likely way to break it is also the most politically tempting path: deliberate inflation. The moment the US begins inflating to erode real debt burdens, it is telling every foreign holder of Treasuries that the yield they are earning is a mirage. The real return collapses even as the nominal yield rises, and capital starts looking for exits. Interest rate parity stops working because the thing it was pricing — a real return in a credible institutional environment — no longer exists.12
This connects directly to ground truth number two: financial repression and inflationary debasement are always available as exits from a debt spiral. But they destroy the very mechanism that currently allows the US to sustain deficits that would sink virtually any other country.
Thanks, as always, for reading. None of these fourteen ground truths individually closes the case; together, though, they sketch the architecture of a slow-moving crisis that neither the "deficit doesn't matter" camp nor the "dollar collapse is imminent" camp properly explains. If you think we've gotten any of it wrong, the comments below are where to say so.
Coronavirus: The Hammer and the Dance, Pueyo, March 2020.
The agency’s most recent baseline (The Budget and Economic Outlook: 2025 to 2035, January 2025) projects debt held by the public reaching roughly $52 trillion by 2035 — and that, even though it reflects a semi-exponential curve, is almost certainly the floor unless there’s a paradigm shift in Washington.
DOGE had even attempted to fire air traffic controllers themselves before Transportation Secretary Duffy personally intervened.
Starr et al. (2014) finds that “rising costs of treatment accounted for 70 percent of growth in real average health care spending from 1980 to 2006.”
Our decomposition splits real Medicare spending into these three multiplicative factors: new-beneficiary inflow per year (×2.57: Baby Boom + population growth + cohort survival to age 65), years each cohort spends on the program (×1.35: life expectancy at 65 rising from 14.6 to 19.7 years), and real cost per beneficiary-year (×7.46).
Here is the technical formula:
Inflow and longevity are conceptually distinct — how many Americans turn 65 each year versus how long they stay enrolled — and the identity is exact: 2.57 × 1.35 × 7.46 = 25.9, matching the actual real growth ratio from 1967 (the first full calendar year of operation) to 2024.
The 7.46× captures everything that isn't beneficiary count or longevity: fee-for-service overuse, new medical technology, the ~$130B/yr Part D drug benefit added in 2006, rising prices, and identified fraud and improper payments.
This is consistent with KFF and Peterson Foundation Medicare growth attributions.
Medicare spending on “skin substitute” wound care products alone exploded from $1.6 billion in 2022 to over $10 billion in 2024, despite limited evidence of efficacy. The DOJ’s “Operation Gold Rush” in 2025 — a network that submitted $10.6 billion in fraudulent catheter claims by exploiting the stolen identities of over one million Americans — was described as the largest healthcare fraud case ever charged.
Nevertheless it is almost certainly underestimated since, by construction, it is hidden. And, it still represents an enormous amount of money — over 20% of the entire Canadian federal budget, for reference.
It is a fair criticism that this is being tested in real time. Time will tell whether US and allied forces can reclaim control over the Strait of Hormuz.
A natural objection is that the euro is the #2 reserve currency without comparable military backing. True — but its ~20% share is roughly one-fifth the dollar's despite a similarly large aggregate economy, which is more consistent with this thesis than fatal to it.
This is not to mention that the economic unionization of a basket of major economies with such diverging economic and geopolitical interests is unlikely.
IRP is a financial theory stating that the difference in national interest rates between two countries should equal the difference between their forward and spot currency exchange rates. It creates an equilibrium where investors cannot earn risk-free arbitrage profits by simply borrowing in a low-interest country to invest in a high-interest country.
It is worth being precise about why inflation is not merely tempting but something the underlying arithmetic pulls toward. In 1981, the economists Thomas Sargent and Neil Wallace set this out in a paper titled “Some Unpleasant Monetarist Arithmetic.”
Their argument runs like this: once a government sets its deficits on its own schedule and the interest rate on its debt runs higher than the economy’s growth rate, the central bank’s control over inflation stops being permanent, however independent it looks on paper. The debt compounds faster than the economy grows, the stock of bonds eventually presses against the limit of what private markets will absorb, and past that limit the only buyer left is the central bank, paying with money it creates. Inflation, in that scenario, is mechanical: the accounting identity finishing its work rather than a choice anyone makes. The reserve-currency demand described in the previous ground truths pushes that limit much further out than any other country could manage. But it does not remove it.
The genuinely unpleasant part is the corollary. The natural reflex against inflation is for the central bank to tighten and hold the line. Sargent and Wallace showed that under these conditions, tightening now can mean more inflation later rather than less: higher rates raise the cost of carrying the debt, which enlarges the stock that eventually has to be monetized, so the central bank buys time and pays for it with a bigger bill. Monetary credibility, in other words, is borrowed time rather than a substitute for fiscal adjustment. It can hold the symptom down for a while, but if the fiscal side never changes course, the suppression only compounds what is being suppressed. This is the arithmetic beneath ground truth five’s “gradually, and then suddenly.”
Really excellent in-depth explainer. I knew most of what is here, but it’s put clearly, succinctly, compellingly, and all in one place in a way that I haven’t had before. This is going to be the #1 place I point people if I talk to them about the debt crisis.
This was the best synthesis of our debt crisis I have seen in years, and a good reminder of how much worse the situation is now than it was in the 2010s (when it was already deeply concerning). It seems clear that, assuming we cannot grow our way out of the debt with AI-derived productivity growth, we will need some sort of Simpson-Bowles 2.0 solution, with far deeper cuts and far larger tax hikes, in an environment that is probably even more partisan than it was in 2011 and certainly more resistant to entitlement reform (even, now, among a few Republican Reps/Senators). It’s frustrating that the public has become less interested in resolving this crisis as it has become more imminent.