

BRICS: The Solvent-Not-Safe Middle Tier
Even modest debt ratios can mask real fragility

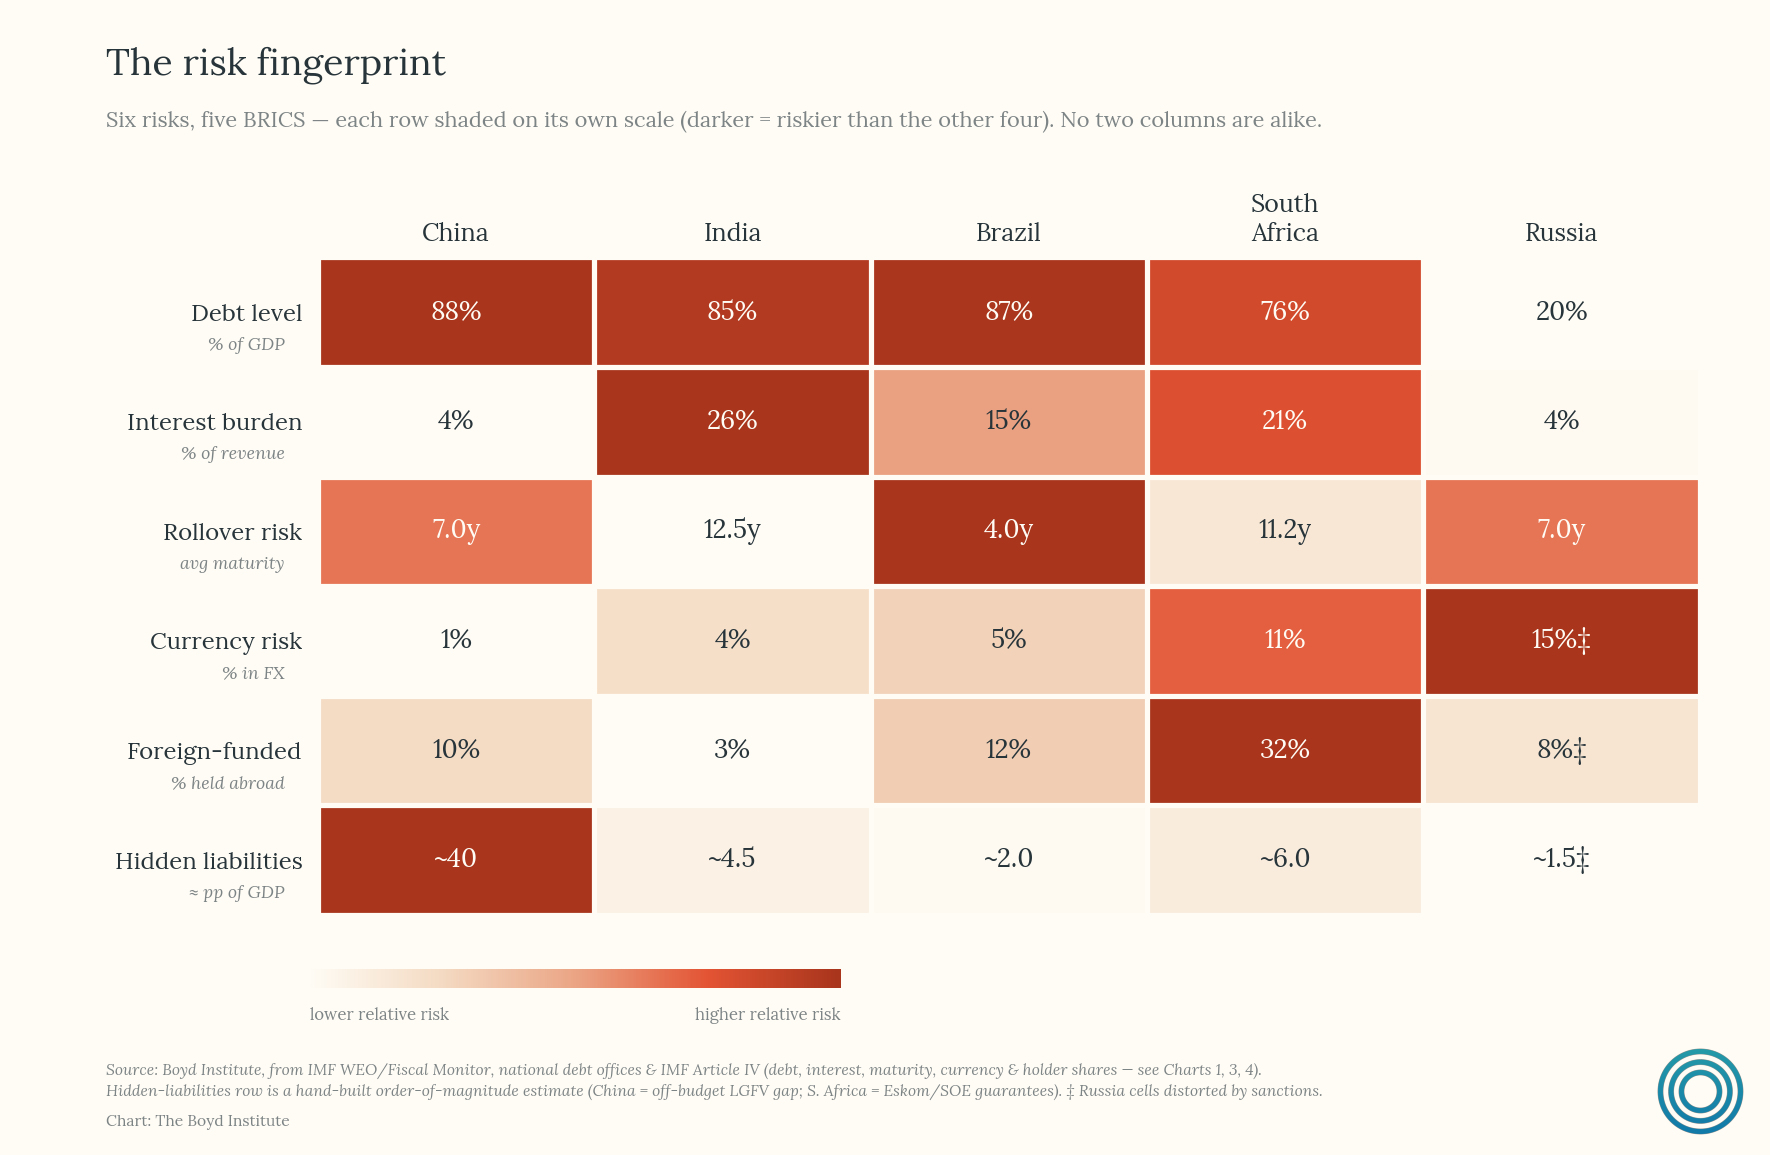
Brazil, Russia, India, China, and South Africa (BRICS) each have built large domestic capital markets and meaningful local-currency borrowing capacity, tools unavailable to most developing nations. Yet none has the deep institutional credibility or reserve-currency privileges that cushion advanced economies like the United States or Japan, which routinely carry far higher debt loads without triggering investor anxiety.
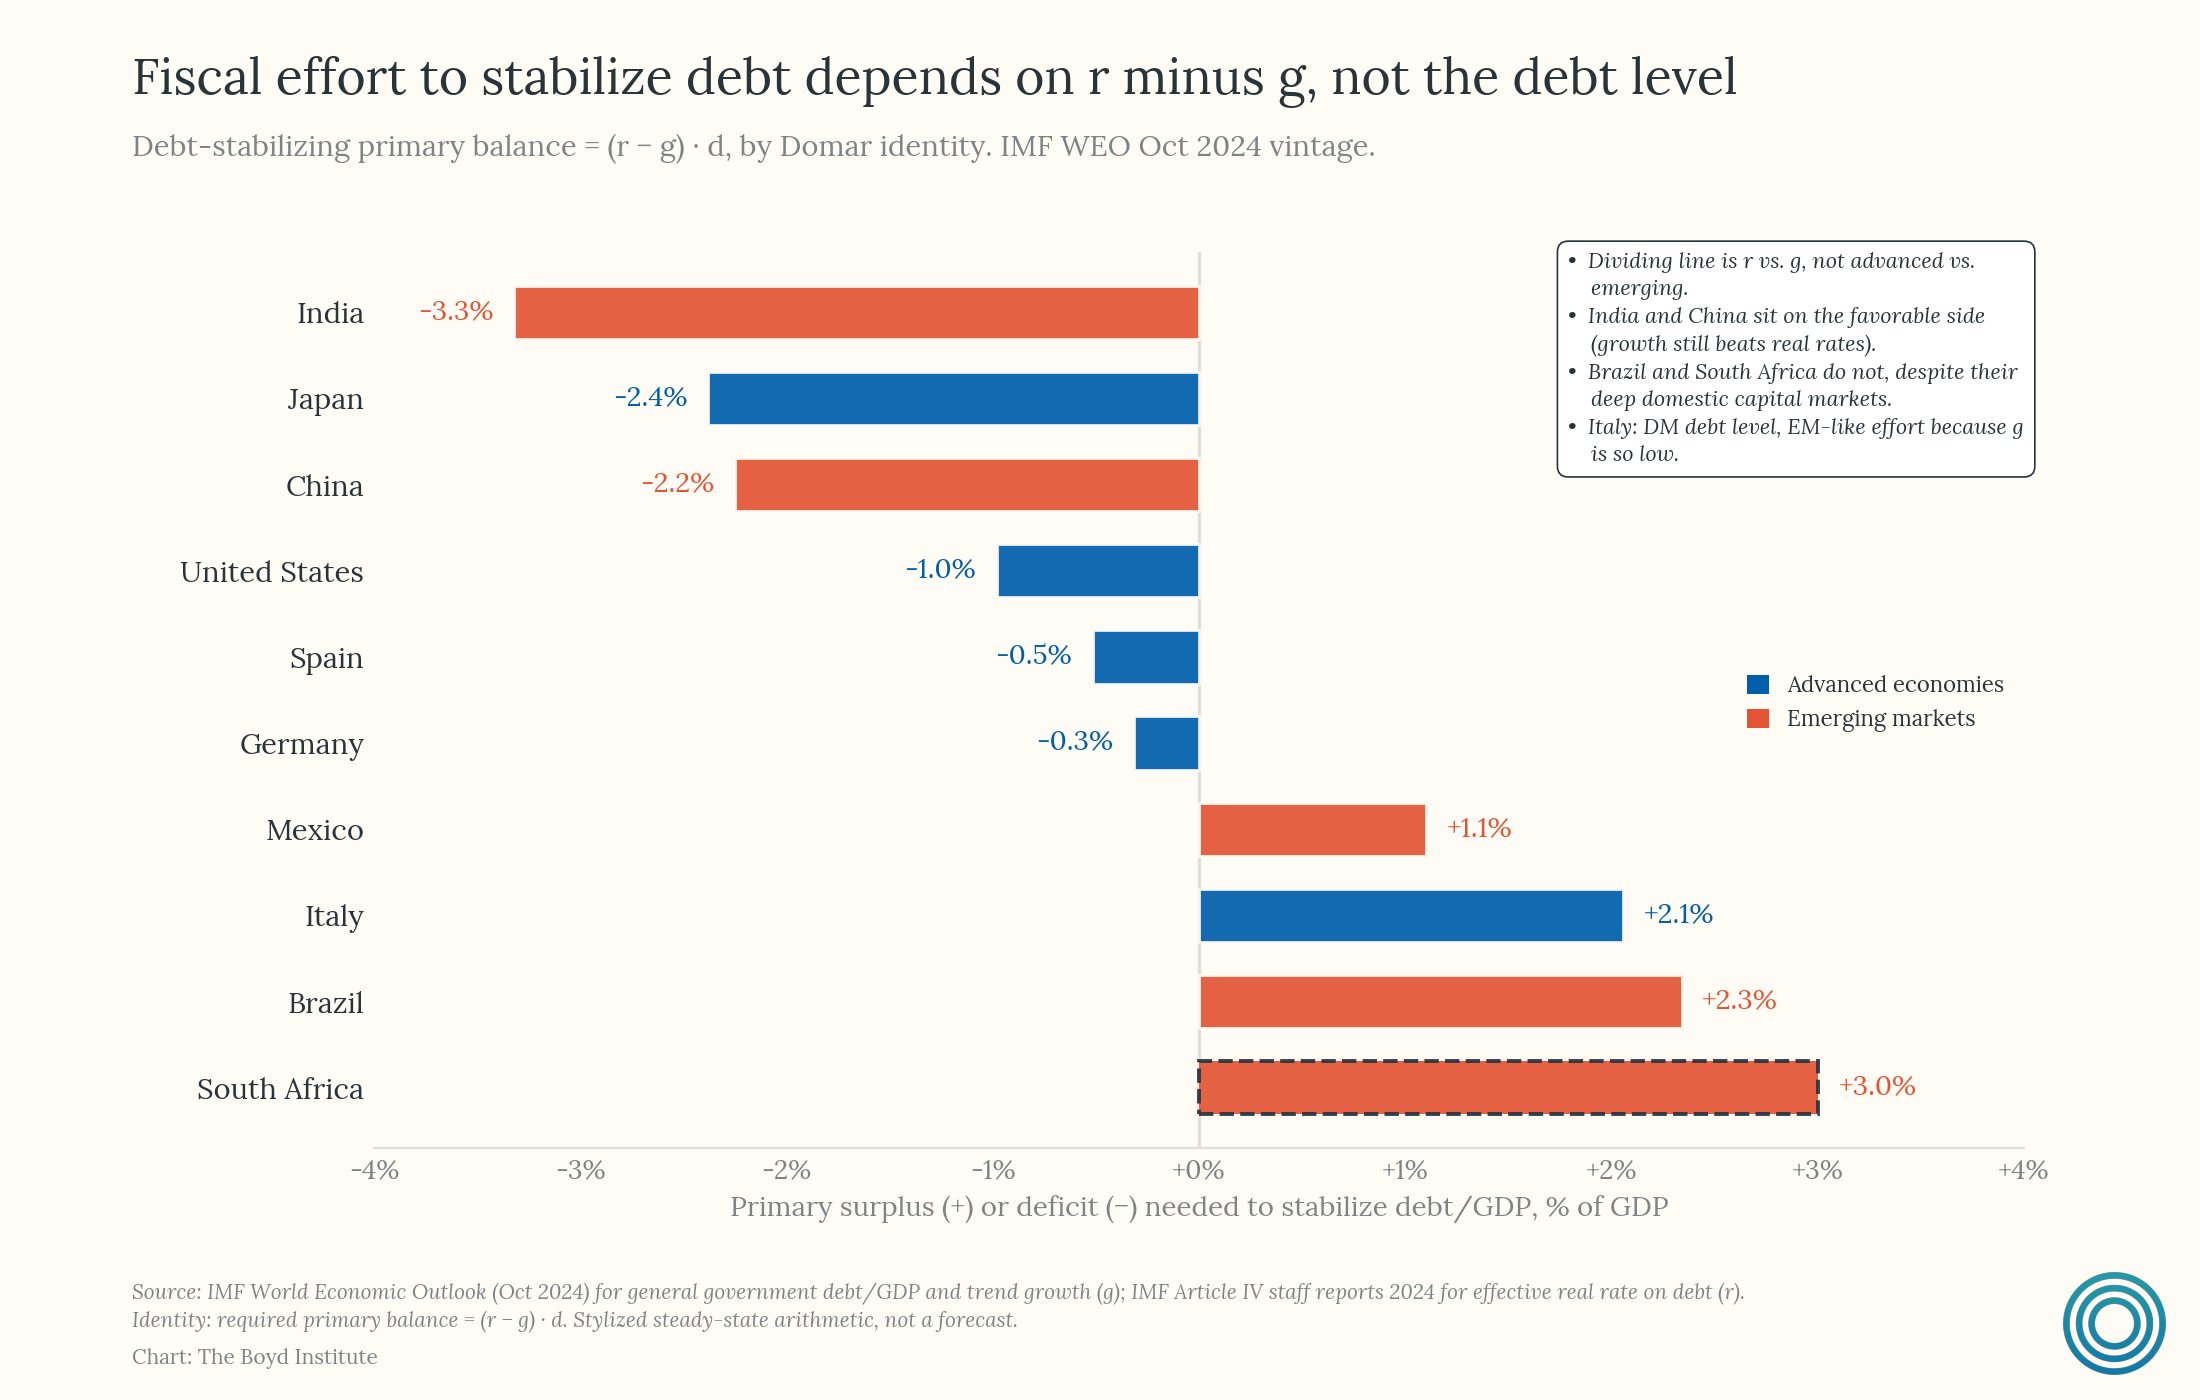
The BRICS nations occupy a genuine middle tier in the global financial system — better insulated than most developing economies, but considerably more exposed than advanced ones to shifts in growth, interest rates, and investor sentiment. A drop in global risk appetite, a domestic slowdown, or geopolitical isolation (as with Russia) can tighten the constraints on any of these countries even when their debt ratios look unremarkable. What determines which side of that line a country falls on is whether sound public finances and durable growth are in place to support it.
Brazil: Deep Markets, Commodity Exposure, and an Unhedged Windfall
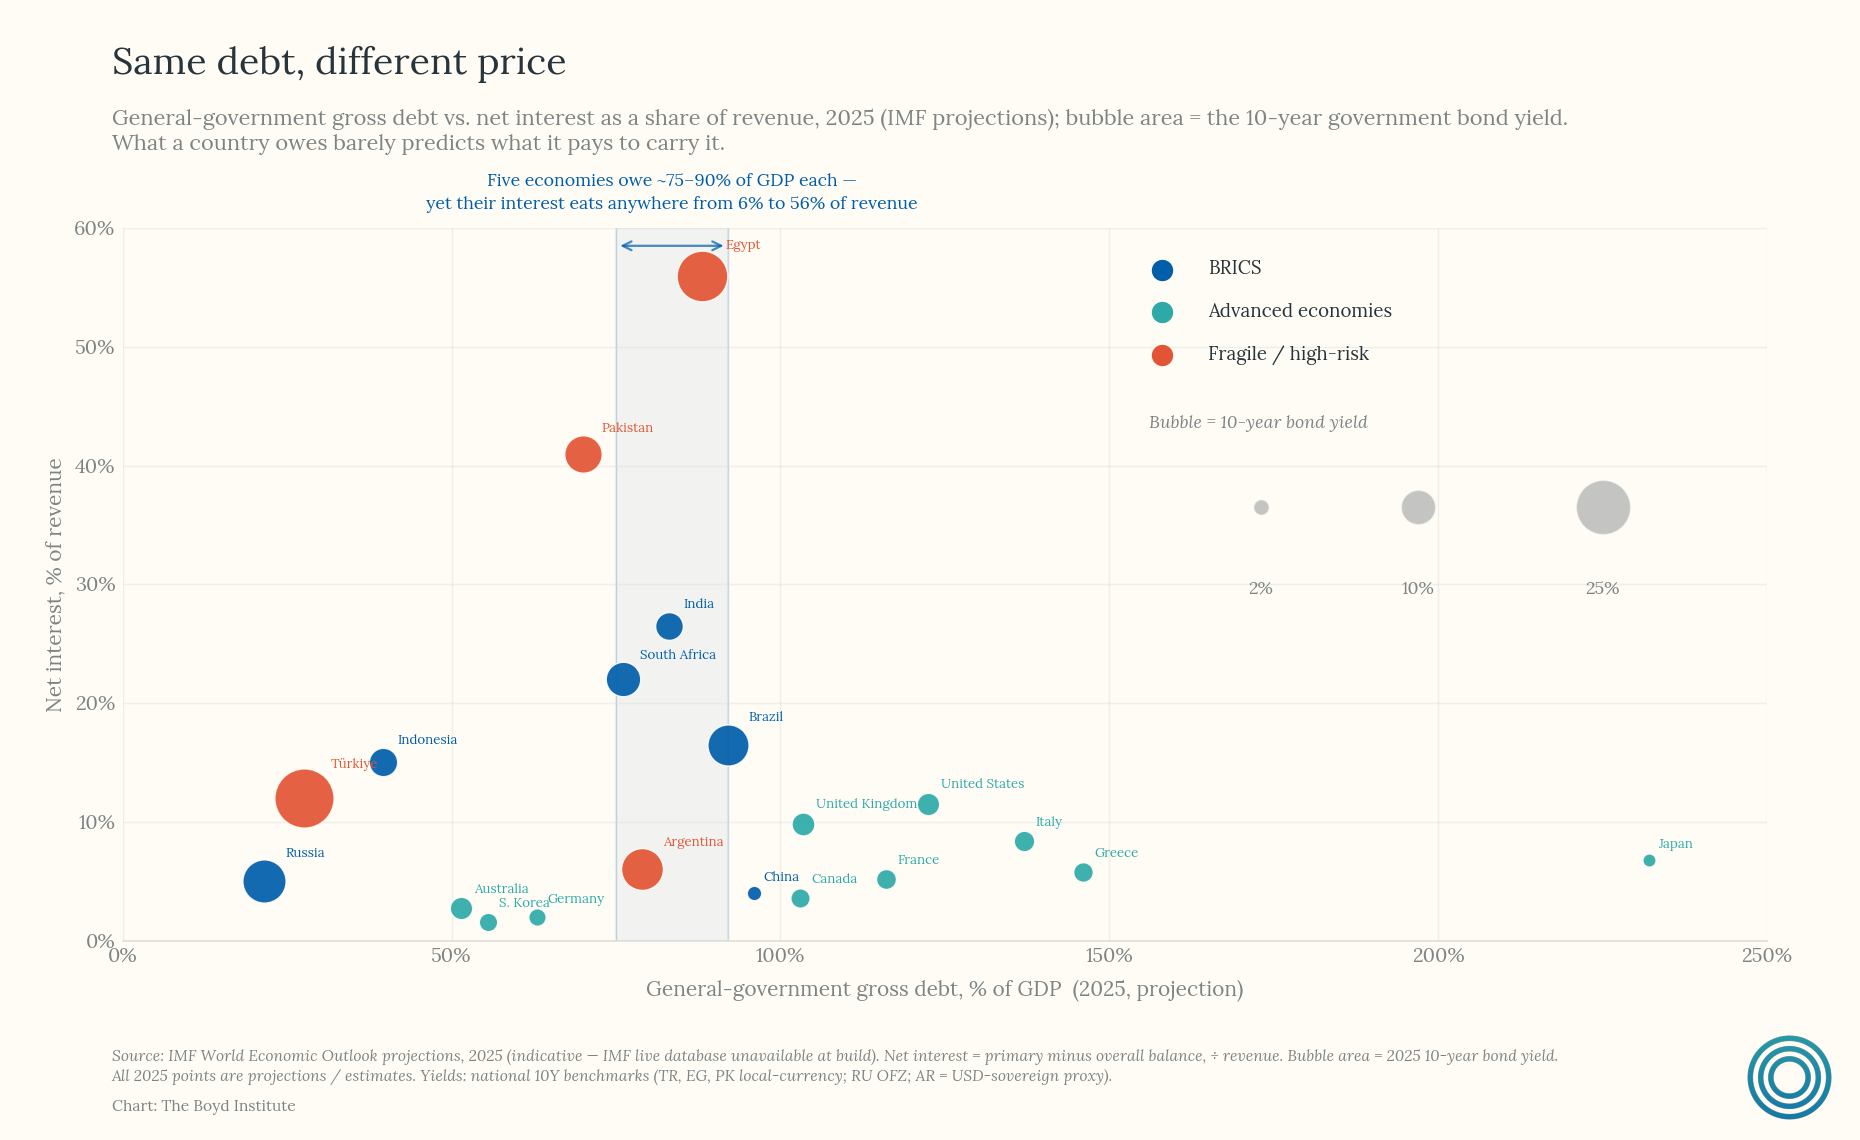
Brazil's debt-to-GDP ratio, which its central bank puts at roughly 80% (IMF says 87%), places it closer to the advanced-economy range than to its developing-country peers. It finances the overwhelming majority of that debt domestically and in its own currency which insulates it from the classic emerging-market trap of foreign-currency debt turning unpayable after a depreciation.
But Brazil’s fiscal story is inseparable from commodities. The early 2010s commodity boom — driven heavily by Chinese demand for iron ore, soybeans, and oil — flooded Brazil with export revenue and fueled a period of fiscal optimism, expanded social spending, and confidence that growth would outrun debt. When prices crashed in the mid-to-late 2010s, that revenue evaporated just as spending commitments remained, contributing to the deep recession and fiscal crisis of 2015–2016.
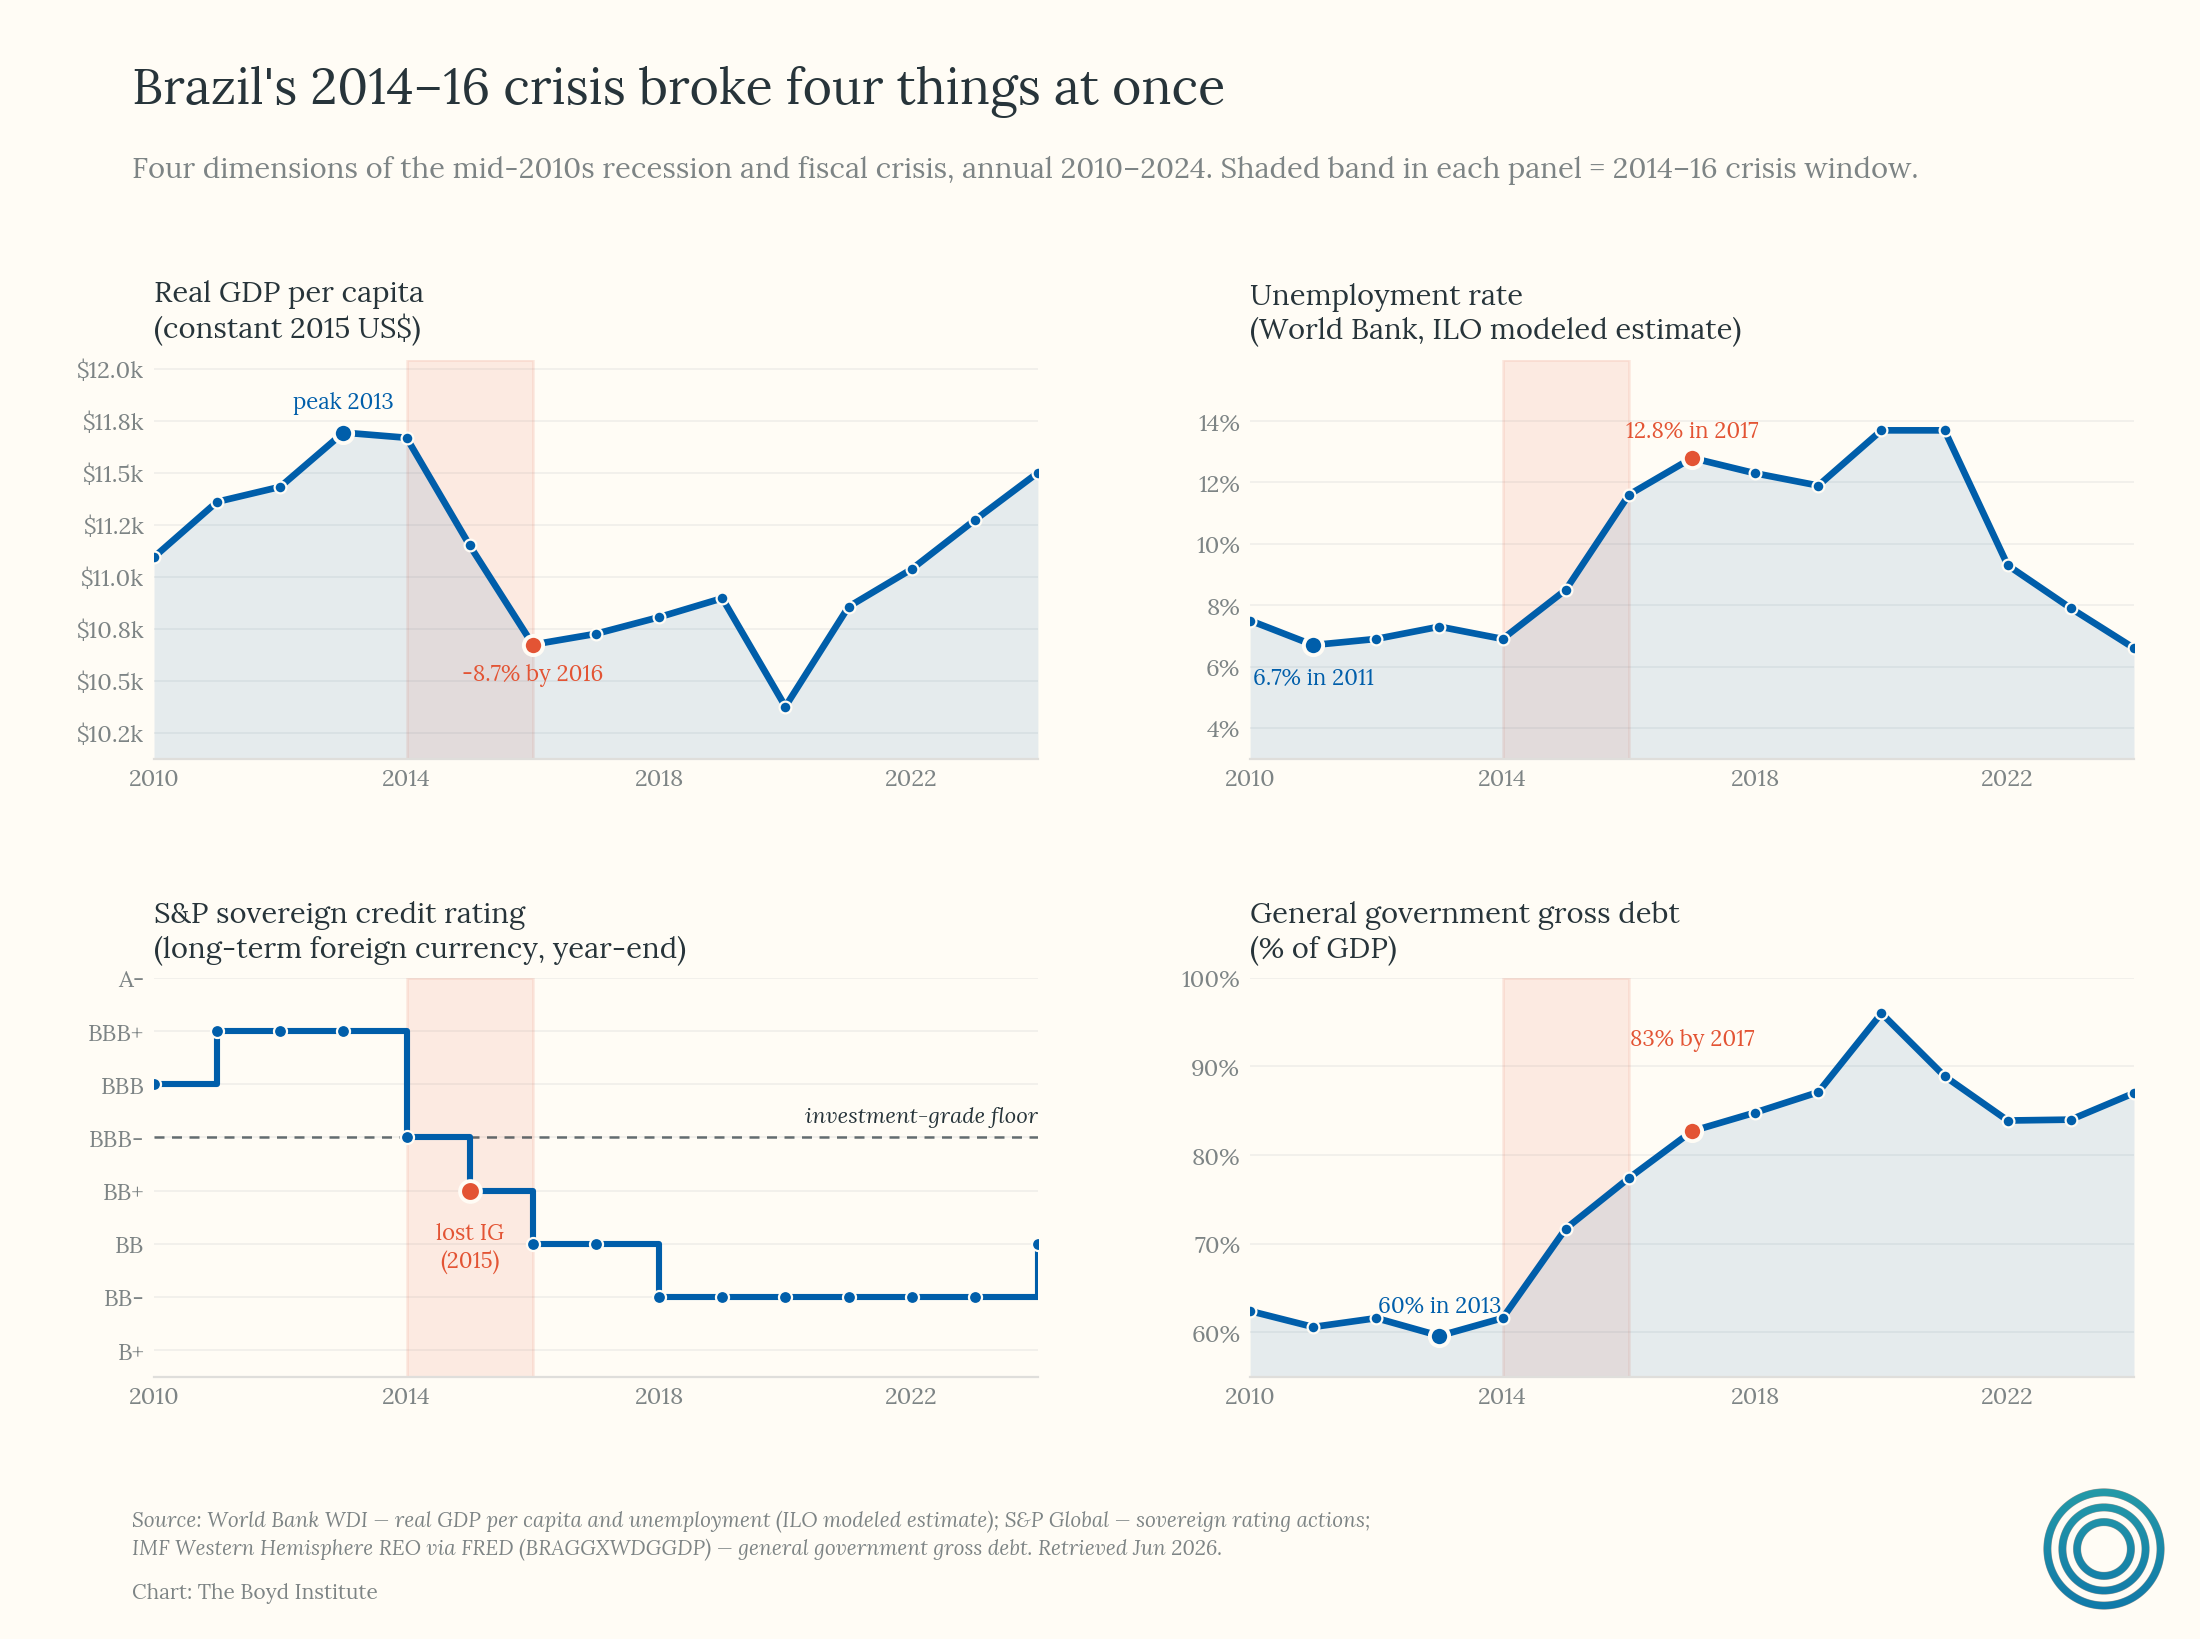
Part of what made the boom-bust cycle so consequential was Brazil’s approach to its major export industries. Brazil has state control over strategic resources — most visibly through Petrobras’s dominant, state-directed role in oil, including pre-salt reserves discovered in the 2000s — rather than channeling windfall revenue into an insulated savings vehicle. The contrast with Norway is instructive: Norway routes its oil revenue through the Government Pension Fund Global, a sovereign wealth fund that deliberately separates resource income from annual budgets and smooths spending across commodity cycles. Brazil never built an equivalent buffer at the same scale, so commodity windfalls flowed more directly into the budget and into Petrobras’s own investment and debt decisions, leaving fiscal policy more exposed to the next downturn rather than insulated from it.
The result is a country with real strengths — a sophisticated domestic investor base and strong debt management — but high domestic borrowing costs and a fiscal position with comparatively little room for error.
Russia: Low Debt, Foreclosed Options
At roughly 18% of GDP, Russia’s sovereign debt burden is among the lowest of any major economy, financed overwhelmingly through domestic sources, with meaningful fiscal reserves built up over years of energy exports. Yet Russia is the clearest illustration that a low debt ratio doesn’t equal financial strength.
Two forces compound Russia’s actual vulnerability. First, its budget remains heavily dependent on oil and gas revenue, so swings in global energy prices translate directly into swings in fiscal capacity.1 Second, the invasion of Ukraine triggered sweeping Western sanctions that cut off much of Russia’s access to international capital markets, froze a large share of its foreign reserves, and isolated its financial system from the channels it would normally use to borrow or hedge abroad.
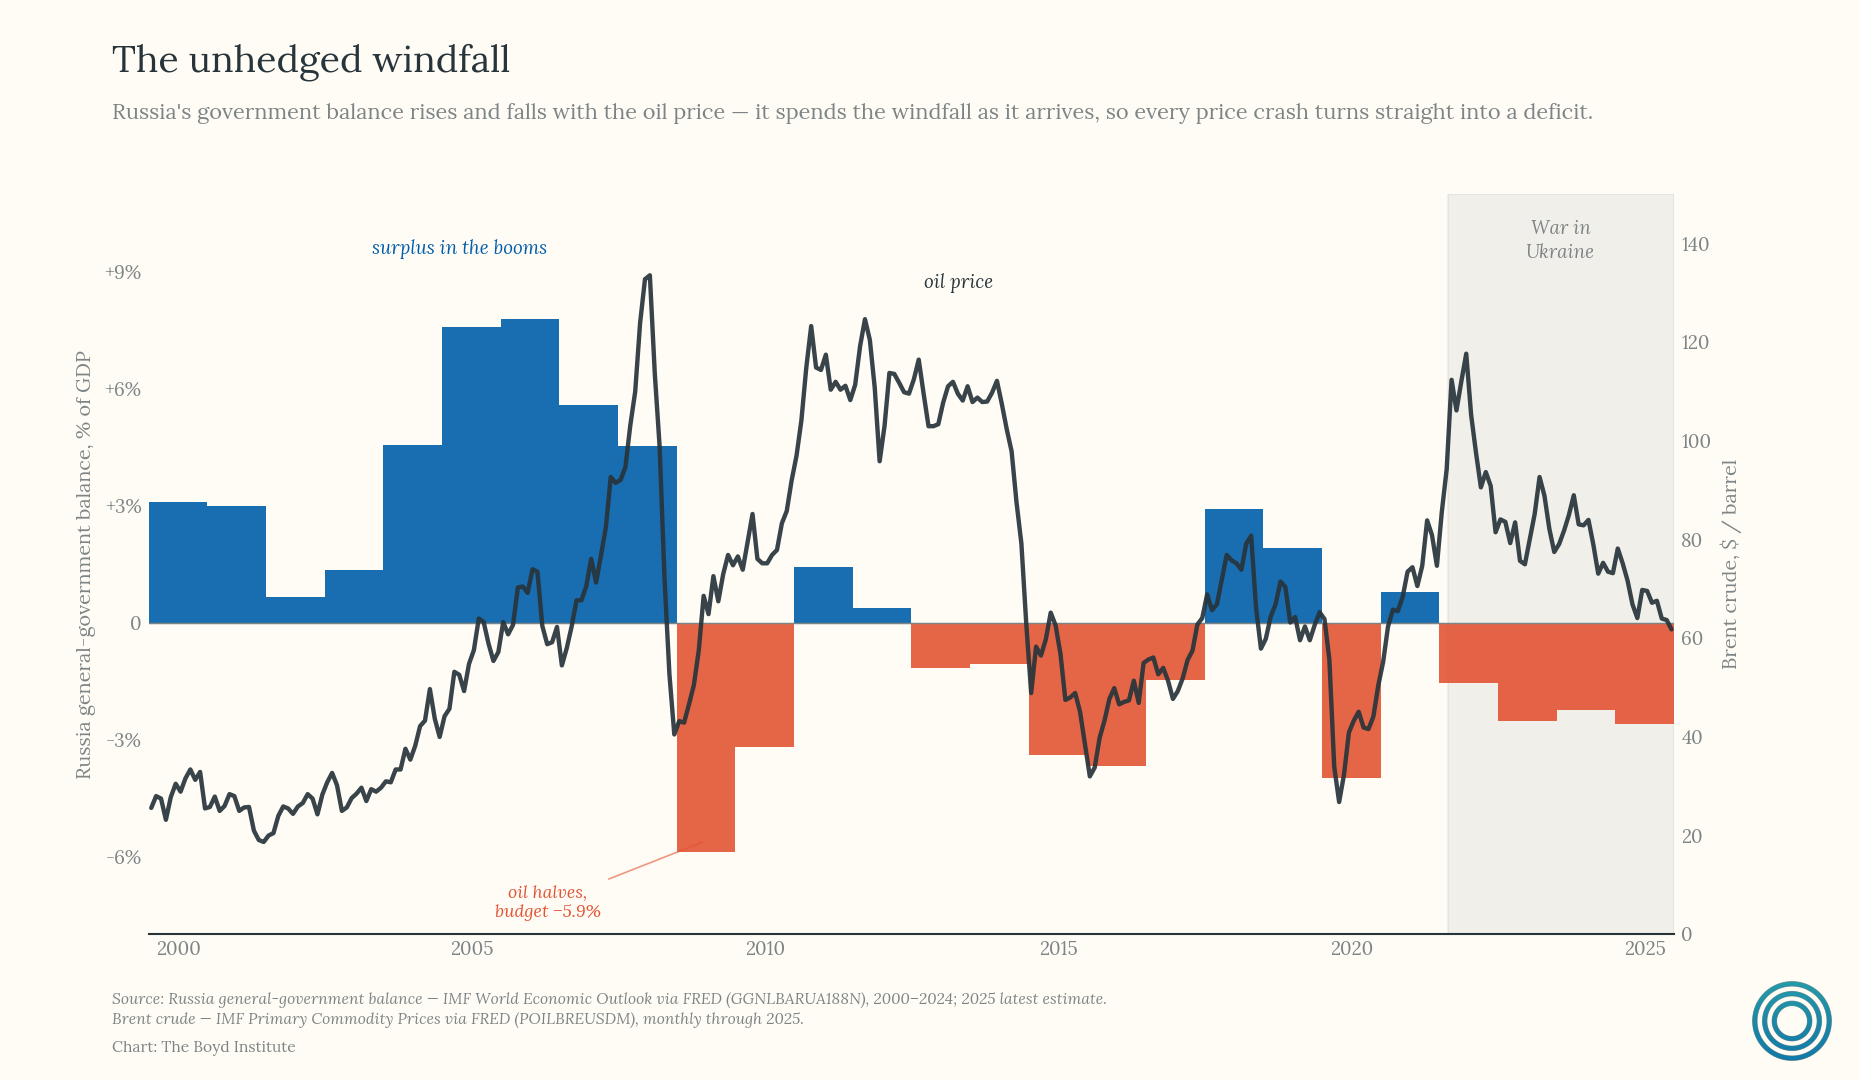
A government can have plenty of room to borrow on paper and still find itself constrained by an inability to access the broader financial system. Russia underscores a theme that runs through all of these cases: the relevant question isn’t only “how much debt” but “what options does this debt leave you” — and a combination of commodity dependence and geopolitical isolation can foreclose options just as effectively as overborrowing.
India: Long-Dated Debt Built on a 1991 Foundation
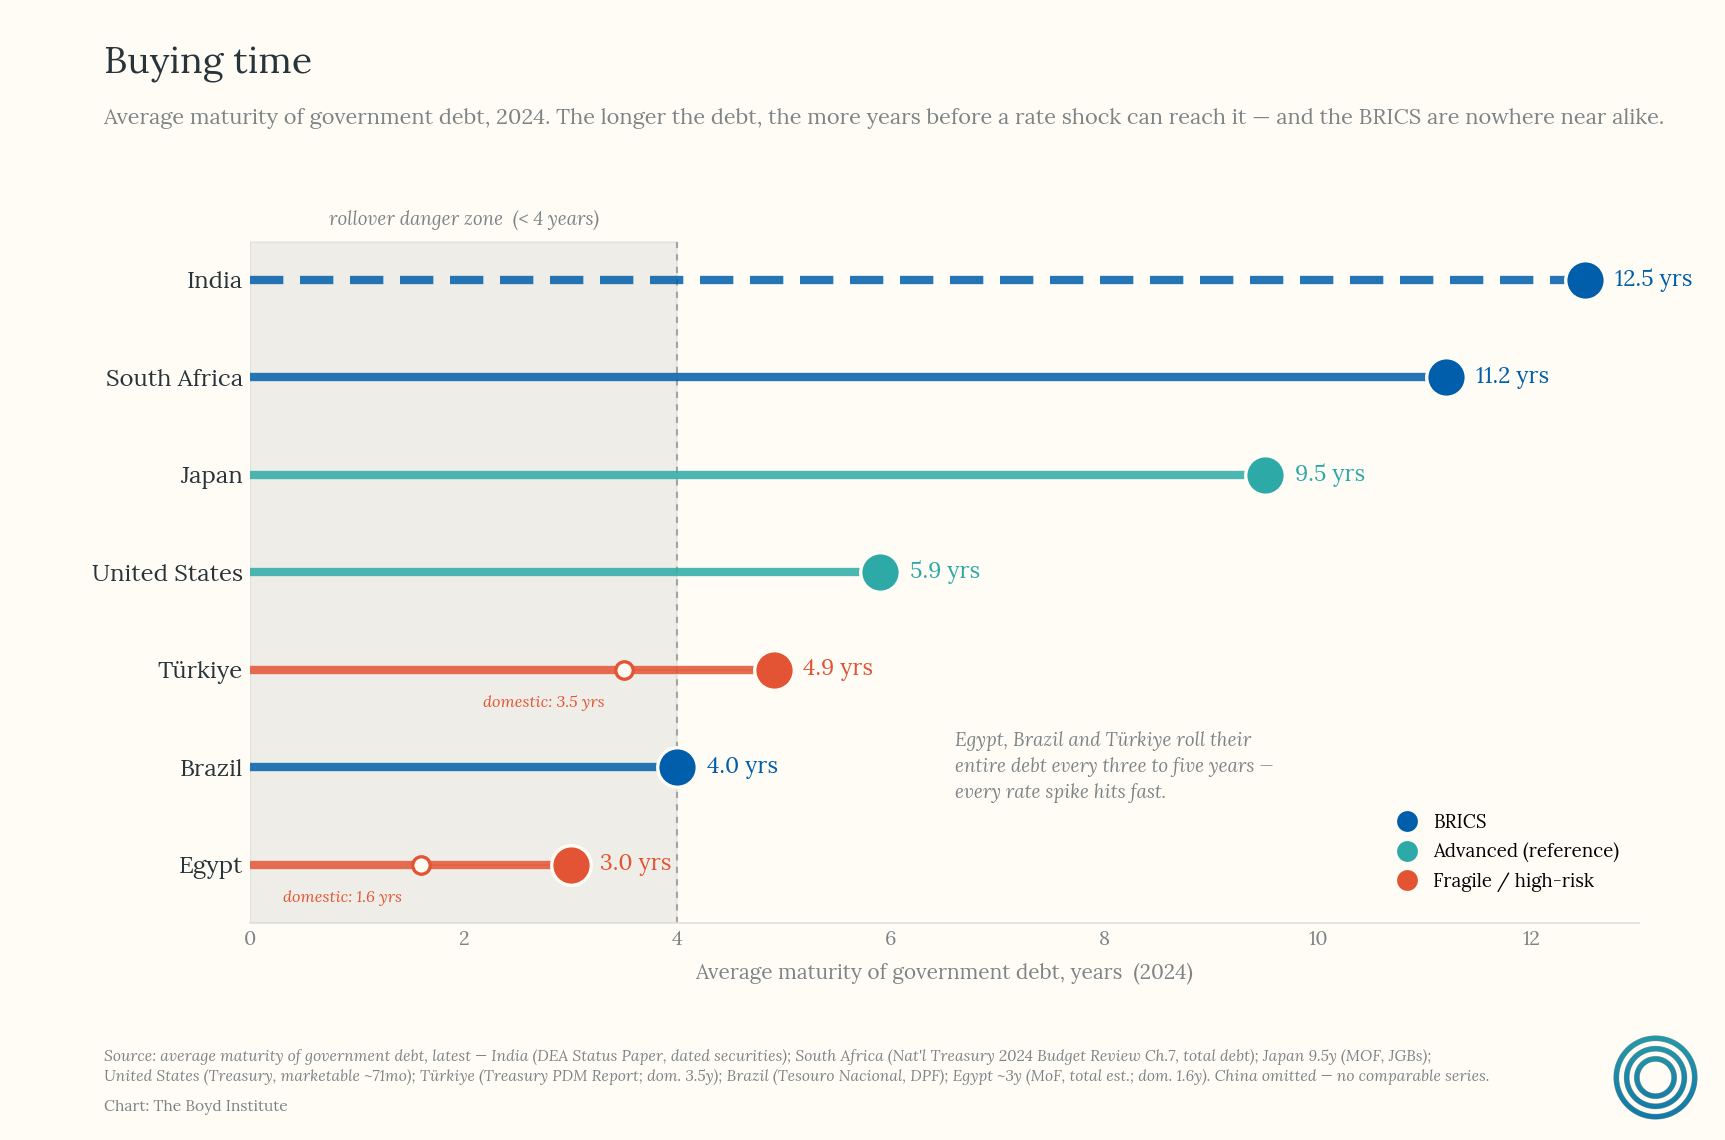
India’s public debt sits at roughly 83% of GDP, financed almost entirely through domestic channels, with very little external sovereign debt. It benefits from a large pool of domestic savings, a deepening bond market, and long average debt maturities that reduce refinancing risk.
Much of this financial architecture traces back to the 1991 balance-of-payments crisis and the reforms that followed. Facing a near-default and dwindling foreign reserves, India dismantled large parts of its license-raj industrial controls, opened its economy to foreign investment and trade, devalued the rupee, and began liberalizing its financial sector. Those reforms set off three decades of faster growth and, over time, the development of a much deeper domestic bond market and a broader base of institutional savers — the very infrastructure that now lets India fund large deficits domestically and at long maturities (weighted average of nearly 13 years) rather than relying on volatile external borrowing.
That history helps explain why India’s debt picture today is one of manageable but not costless debt: a larger, faster-growing GDP base makes debt easier to carry over time, but persistent fiscal deficits and high interest payments continue to consume a significant share of government spending, leaving the trajectory dependent on continued strong growth.
China: A Headline Number That Hides the Real Fiscal System
China’s case is the most complicated in the group because its headline sovereign debt-to-GDP figure (88.3%) captures only a fraction of the relevant fiscal picture. The IMF’s “augmented” measure, which folds in local government financing vehicle debt, puts the real figure closer to 117% of GDP as of 2024 and projects it stabilizing near 150% in the coming years. That gap — nearly 30 points of GDP hidden from the headline number — is the story.
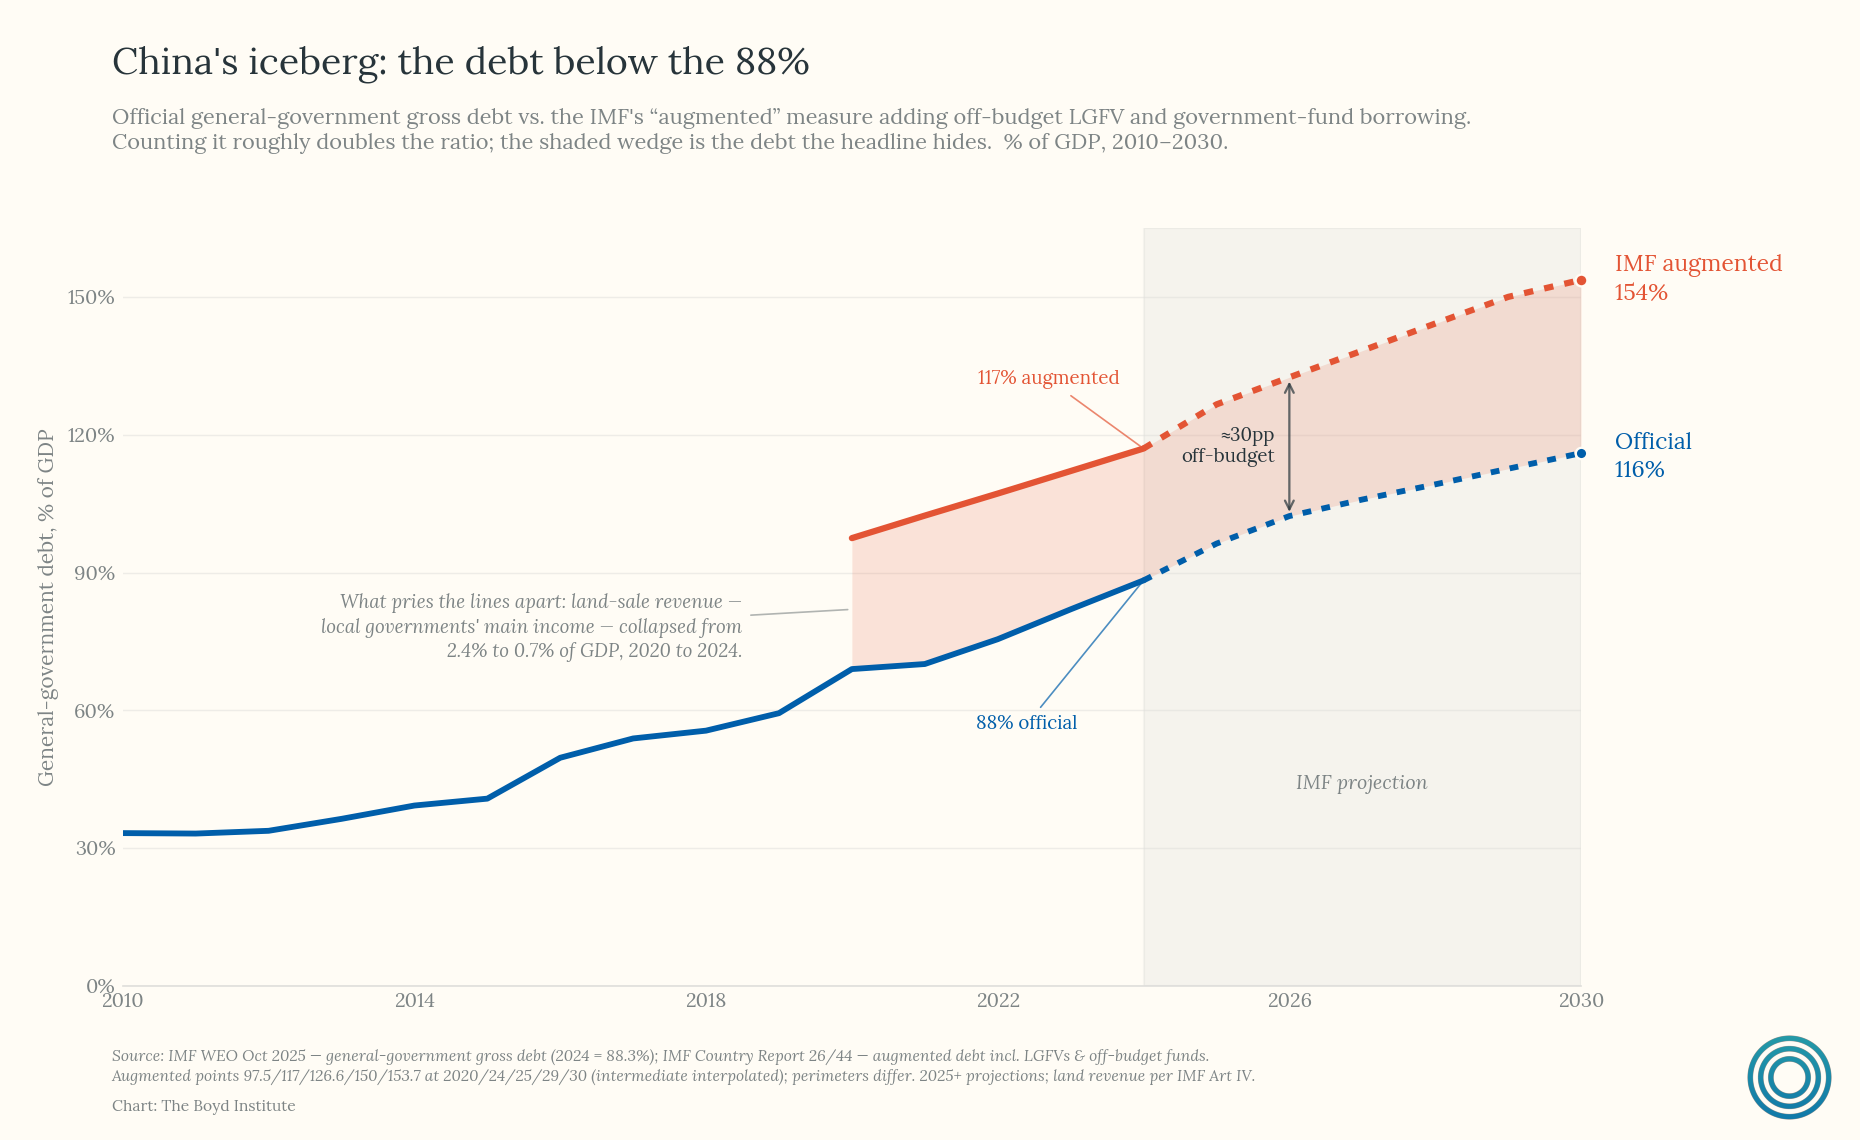
To understand why, it helps to look at how China’s fiscal system actually evolved. The 1994 tax-sharing reform raised the central government’s share of tax revenue from about a fifth to over half almost overnight, mainly through the VAT, while leaving expenditure responsibilities largely unchanged. Local governments still finance roughly 70% of public spending: a structural vertical fiscal gap that every pillar since has been improvised to fill.2
Land sales became the substitute tax system, booked off-budget in separate “government funds” largely outside the headline books. Land-use-rights sales peaked at 38% of local revenue in 2021, then fell by a third by 2023 as the property sector cracked — exposing local budgets in ways the headline debt figure was never built to show.
State-owned enterprises, despite their political prominence, are a surprisingly minor fiscal pillar: SOE dividends to the state were only introduced in 2007, remain low by global standards, and as much as 90% is recycled back into the enterprises rather than into public budgets.
That leaves debt — particularly through local-government financing vehicles, or LGFVs — as the fourth and most opaque revenue source. Local governments use these off-balance-sheet companies to borrow for projects that mostly don’t pay for themselves, with the median LGFV earning about 1% on its assets in 2022 while borrowing at over 5%, kept alive only by an implicit central backstop.3
The whole system was built for an era of high growth, optimized around investment — VAT, land sales, credit — rather than recurring local taxation. It boomed with the hot real estate market but is now buckling under a slower-growth era, with structural deficits already near 6-7% of GDP (what Rhodium Group calls “the myth of China’s fiscal space”) and falling land revenue. The obvious fixes — a property tax (blocked for years), higher SOE dividends, greater central assumption of local costs — are politically foreclosed. The lesson is that sovereign-debt statistics can badly understate real fiscal risk when large quasi-fiscal and sub-national liabilities sit outside the headline number — in China’s case, by roughly 36 points of GDP, and rising.
South Africa: Institutional Strength Built After Apartheid, Tested by Stagnation
South Africa’s debt-to-GDP ratio of approximately 79% is financed mostly domestically, supported by an independent central bank and a genuinely deep local capital market.
Those institutions are themselves a legacy of the post-apartheid transition. The African National Congress government that took power in 1994 inherited an economy isolated by decades of sanctions and underinvestment, alongside enormous pressure to fund redress for apartheid-era inequality in housing, education, and basic services. Rather than running large deficits to finance that redress, post-1994 governments pursued relatively orthodox macroeconomic policy — fiscal discipline, an independent reserve bank, and capital-market liberalization — partly to win the credibility and investor confidence needed to integrate into global markets after decades of isolation. That choice built the deep, credible domestic debt market South Africa relies on today.
But that credibility didn’t hold in a straight line. Looking across the three decades since 1994, South Africa’s fiscal trajectory runs through four distinct phases. The first, from 1994 to 1999, was one of successful fiscal consolidation, as the new government moved to allay earlier fears of populist overspending and got the public finances onto a sound footing. The second, from 2000 to 2008, built on that base with a genuinely healthy fiscal track record, coinciding with the country’s longest economic upswing since the Second World War.
The third phase, from 2009 to 2020, was effectively a fiscal storm: the global financial crisis hit revenue just as “micro fiscal populism,” the state capture era under the Zuma administration, and eventually the Covid-19 pandemic pushed spending and borrowing sharply higher. It was during this period that South Africa lost the investment-grade credit rating it had spent years earning, as its foreign-currency government bonds were downgraded to junk status by Moody’s in 2020.
This was followed by a fourth phase of renewed consolidation, marked by a shift away from relying on growth alone to cure fiscal imbalances and toward direct fiscal reform.
The Common Thread
Across all five countries, debt composition matters more than the debt ratio itself, and history shapes that composition as much as current policy does. Brazil’s commodity windfalls went largely unhedged rather than into a Norway-style buffer. Russia’s energy dependence and post-2022 isolation matter more than its low debt ratio. India’s domestic financial depth traces back to the reforms forced by its 1991 crisis. China’s local governments inherited a structural revenue gap from 1994 that land sales and LGFV debt have only papered over. South Africa’s institutional credibility was built deliberately after 1994, and is now being tested by the growth it needs to sustain it.
None of the five faces the classic developing-country crisis triggers — heavy external borrowing, foreign-currency liabilities, weak revenue systems. But none has the unquestioned credibility that lets Japan or the United States carry far higher debt loads without investor anxiety. They sit in the middle, and the details of how each got there are the real story.
What separates the more resilient cases from the more fragile ones, in the end, comes back to the same two fundamentals: sound public finances and the growth to sustain them. Where both hold — as in India’s deepening bond market — debt becomes easier to carry over time. Where either falters — Brazil’s unhedged commodity exposure, Russia’s foreclosed financial options, China’s hidden local-government liabilities, and South Africa’s economic stagnation — even a modest debt ratio can mask real fragility.
We also saw this in the former Soviet Union, where the collapse in oil prices during the 1980s undercut the hard-currency revenue Moscow relied on to import grain and fund its economic and military commitments.
Beijing already fills much of that gap through transfers — by 2009 roughly 47% of local revenue came from central rebates and grants — so a local fiscal shock is never purely local.
Chinese banks lent heavily to the LGFVs, so a wave of defaults would ricochet into the financial system and force the central balance sheet to absorb it — the local problem "resolved" by moving it upward.