

Poverty Management and the Marginalized Middle | Part 3
Existing housing policy regimes structurally discriminate against young, middle-income households


This is the third part in our series of articles on how and why housing policy should invest in young, middle class families. In parts one and two, we made the case that young, middle-income households and families present the best ‘returns-to-society’ profile for policy targeting. Today we want to address the ways in which current housing policy, in favor of poverty management, structurally discriminates against exactly this group.
Note: for the sake of brevity and flow, this article is footnote-heavy. We encourage the highly substance-oriented reader to click and read the footnotes where curious!

The current housing-policy regime is perhaps the clearest case study in how institutional imperatives conflate visible need with economic leverage. It routes deep subsidies toward those most visibly struggling (low-income households) while simultaneously neglecting those whose marginal decisions carry the largest economic, demographic, and fiscal consequences: young, educated, middle-income, dual-adult households planning to raise children. That this cohort is priced out of major markets is widely miscast as market failure. It is not. It is policy design. And the story is not merely about affordability; it is about the institutional architecture of US housing — federal programs, state policy regimes, local zoning and development mandates, and credit-access systems — all of which interact to marginalize the middle class.
Two intellectual errors underwrite the policy architecture. First, housing affordability has been misdiagnosed as a predominantly low-income problem, best treated through poverty-management programs. Second, middle-income households (those earning roughly 80–120% of area median income, or AMI) are presumed capable of self-correction — either by earning more or by relocating to cheaper markets. Both assumptions are dubious. Middle-income households face binding constraints on family formation and upward mobility that cannot be resolved through individual adjustment. The evidence increasingly shows that they are the cohort most systematically excluded from the benefits and protections of housing policy.
The bottom-focused federal infrastructure
Over the last half-century, a sophisticated advocacy infrastructure has developed around low-income housing: nonprofit developers, tenant unions, federal grantees, and national organizations whose funding and legitimacy hinge entirely on serving the poorest households. Within that Frankensteinian ecosystem, any shift of resources toward the “merely struggling,” or “not poor but not rich” is framed as betrayal of extremely low-income (ELI) households.
Take the Low-Income Housing Tax Credit (LIHTC) program — the largest federal affordable housing program, supporting construction or rehabilitation of ~90-100k units annually. LIHTC specifically targets households at 50-60% AMI1, meaning that a household at, say, 85% AMI — solidly middle-income in most metros — is categorically excluded.
Critically, the National Low Income Housing Coalition has explicitly opposed middle-income housing tax credit proposals, arguing that “in most communities, the private sector can — and does — meet the housing needs of middle-income renters without any government subsidies.” This position, while insisting that all scarce federal resources flow exclusively to ELI households, ignores the empirical reality that middle-income households in expensive metros also face severe cost burdens.
Such arguments reveal the political economy trap: housing advocacy organizations have institutional incentives to preserve their mission focus (serving the neediest) even when doing so excludes the cohort most responsive to marginal cost changes and most capable of generating positive fiscal returns.2 The result is deliberate exclusion masquerading as moral priority.
Federal down payment assistance programs offer another salient example of this exclusion. Of 2,624 down payment assistance programs nationwide, only 10% have no income limits. The overwhelming majority impose 80% AMI cutoffs leaving middle-income families most likely to successfully complete homeownership without support. The 80% threshold exists not because of economic logic but because “low-income” was defined at this level in federal statute decades ago. The cutoff is historical artifact — yet it functions as categorical exclusion.3
Section 8 vouchers follow identical logic, capping eligibility at 50% AMI with priority given to those at 30% AMI. A household at 51% AMI faces years-long waiting lists; one at 80% AMI is categorically ineligible.4
Federal policy thus creates a binary: qualify for deep subsidies (bottom quartile) or compete in market-rate housing with no support. The productive middle has no category. Unfortunately this reality extends to the state and local levels as well.
State and local reproduction
As far as state policies explicitly addressing middle-income households go, some states have developed “workforce housing” initiatives — distinct from traditional low-income affordable housing but modest in scale and funding. Workforce housing is typically defined as housing for households earning 80-120% of AMI (some programs extend to 140% in specific occupations), targeting occupations like teachers, nurses, firefighters, and police officers — roles essential to community function but insufficiently compensated to afford market-rate housing in expensive metros.5
These programs are a good start, and remain exceptions to the bottom-focused policy apparatus. But they are chronically underfunded relative to the scale of need. The reality is that the teacher couple earning 110% AMI with two children and no parental wealth still struggles to access subsidized units while remaining priced out of market-rate housing.
More troublingly, federal HOME program rules restrict funding to households below 80% AMI (with 90% of recipients below 60% AMI), preventing states and localities from using federal resources for workforce housing above those thresholds. This creates a regulatory ceiling: even jurisdictions wanting to serve higher-income workers face federal funding constraints. Furthermore, the workforce housing programs that do exist are typically small, locally-specific programs rather than comprehensive state policy.6
Aside from workforce housing initiatives, most of the rest of state and local housing policies remain bottom-focused. Inclusionary zoning (IZ) is a prevalent one. These laws require that developers include a percentage of below market-rate (affordable) units when constructing new multifamily. Mandates vary, but commonly range from 10-25% of units at 50-60% AMI affordability.

The political economy of IZ can be favorable since it doesn’t need dedicated funding, and “affordable housing” mandates ostensibly sound virtuous.7 But in practice, it largely limits the economic feasibility of multifamily construction, effectively operating as a tax on all local renters.8 These distortionary effects are well-documented and substantial.9
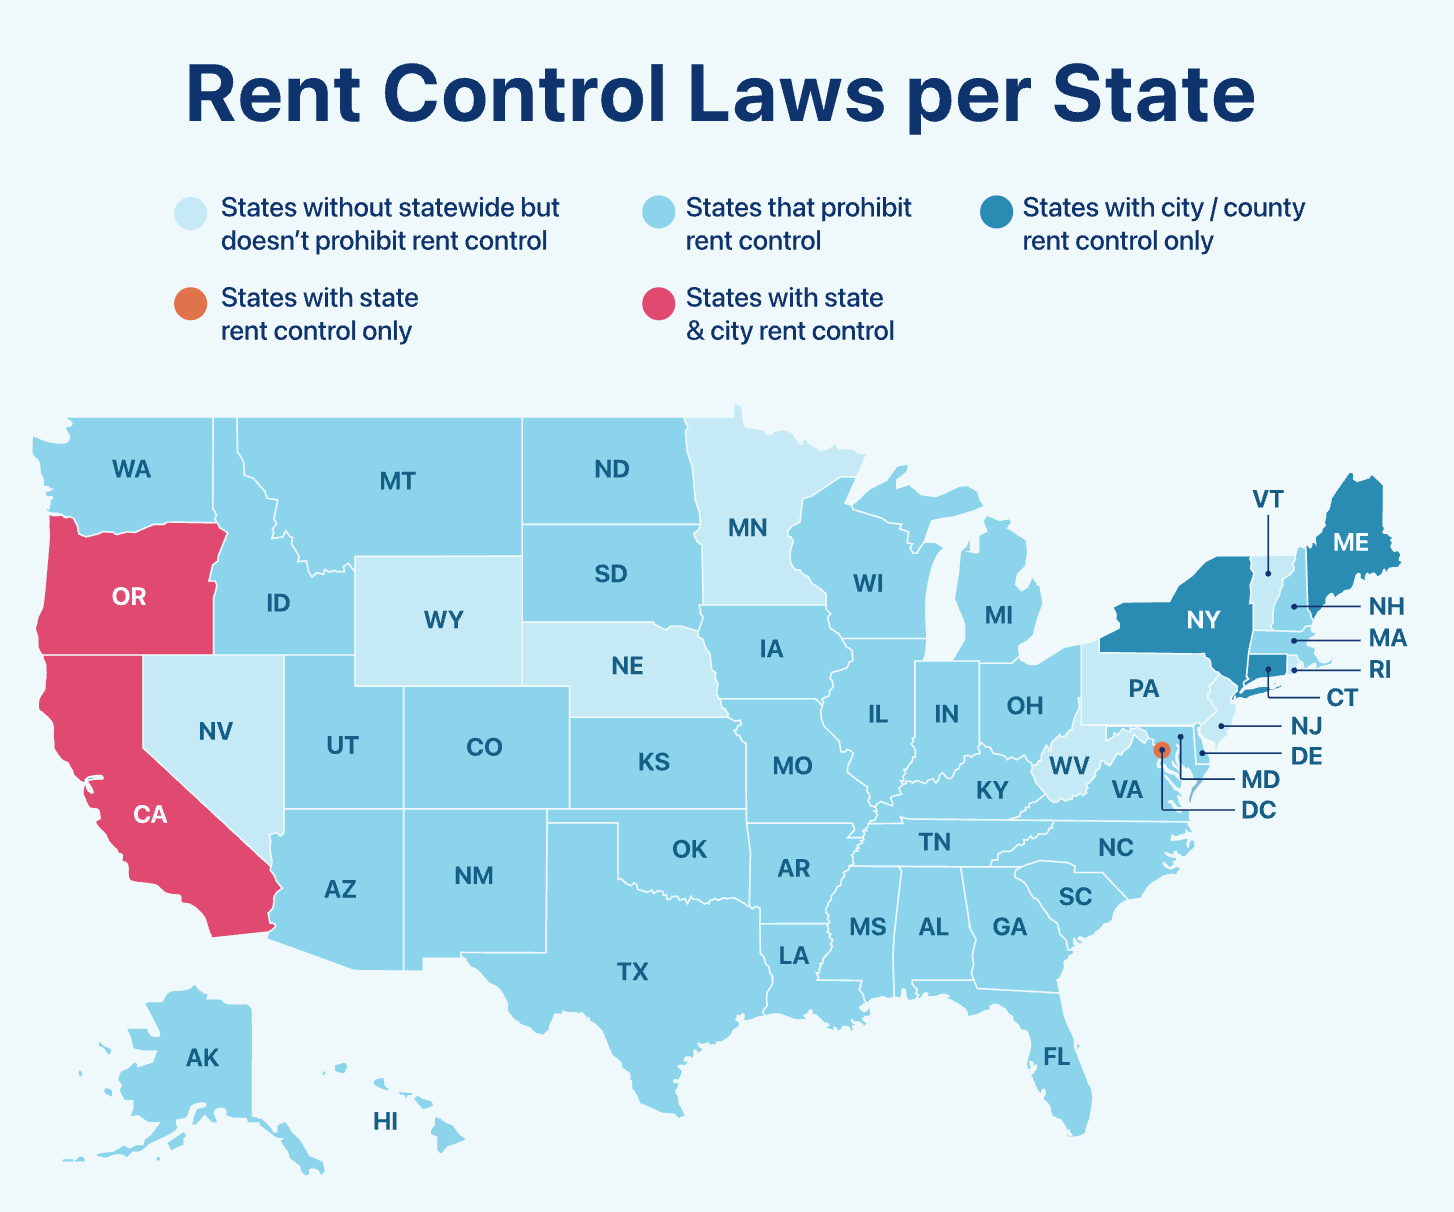
Another example — one that is hated by nearly every economist — is rent control, where rent increases are capped on existing units, meaning longer tenant tenure generates larger discounts relative to market rates. These policies, empirically speaking, marginalize young, middle-income households and families in favor of entrenched low-income households. Though prohibited in most states, several major markets still allow it (and are actively increasing its prevalence).10
Again, empirically speaking, rent control actively reduces the quantity and quality of rental supply.11 In San Francisco, expansion of rent control to small multifamily housing was shown to have increased condo conversions and decreased rental availability. Low-income residents who remained in gentrifying neighborhoods overwhelmingly lived in public housing or rent-stabilized units, while new entrants (young families, migrants) were forced to pay higher market rates for fewer, lower-quality units.
Rent control consistently creates a two-tier system where the stability of insiders (low-income incumbents who rationally refuse to move) is subsidized while would-be newcomers to a city are boxed out. It kneecaps mobility for everyone involved but disproportionately hurts young, upwardly mobile professionals — a cohort already struggling with family formation — by removing their ability to relocate for opportunity or for family size needs.
The paradox is that the above policies — IZ, rent control — while intended to prevent displacement, actually accelerate it. Whereas filtering12, in an unconstrained market, allows aged housing to become affordable, such policy impediments actually reverse the effect.13 Moreover, “workforce housing” initiatives hardly make a dent (and are often sub-tiered to be more inclusive of <80% AMI households).
The distributional consequences extend beyond aggregate supply effects or diminished housing quality: it limits the flourishing of high-human capital, upwardly mobile households — the households that yield the highest demographic dividends to society.
The disappearing middle-income scaffolding
The policy architecture would be merely discriminatory if market alternatives existed. But they increasingly do not. The vast majority of America’s affordable rental stock is actually not subsidized at all — it is naturally occurring affordable housing (NOAH): older walk-ups, garden apartments, two-to-four flats with market rents accommodating 60-120% AMI households. Collectively, NOAH accounts for 75-80% of all affordable units nationwide, and 36% of all multifamily units, totaling ~5.5 million units.14
Critically, NOAH “mainly benefits middle-income households — a demographic often overlooked by tenant-based and project-based rental assistance programs,” according to the National League of Cities. This is precisely the middle-income scaffolding our housing debate ignores in favor of the ELI households for whom even average NOAH unit remains out of reach without additional subsidy. And NOAH is disappearing rapidly. Since 2012, the US has shed 2.1 million rentals under $600/mo (inflation-adjusted) and another 4 million between $600–$999 — 6.1 million low-rent units gone as new supply has skewed to the top and bottom of the market.15
This loss of NOAH directly eliminates the market-rate pathway through which middle-income households have historically achieved housing security and wealth accumulation. It is no coincidence that all federal housing subsidies — including LIHTC and project-based vouchers — are legally tethered to households earning below 80% AMI, leaving the core of NOAH’s occupants entirely unprotected when these properties transition hands.
Policy response — even at the state and local level — has been nonexistent. There are no meaningful tax incentives or favorable financing to preserve it, no right-of-first-refusal rules to let municipalities purchase it before gentrification, and no dedicated funding stream for preservation. This is just a massive failure — NOAH remains virtually invisible in housing policy despite being the largest source of affordable housing for middle-income families.
The architecture must be reformed
The pattern across federal, state, and local policy is systematic. Federal programs (LIHTC, Section 8, down payment assistance) impose categorical income limits that exclude households above 50-80% AMI. State workforce housing initiatives reproduce federal targeting logic. Local inclusionary zoning and rent control reduce market-rate supply while serving only the poorest. Meanwhile, NOAH — the only market mechanism serving the middle — disappears without policy protection.
At virtually every level, the middle 80-120% exists in a void where policy support should exist. This is not market failure but rather institutional design reflecting where advocacy organizations have focused, where political constituencies mobilize, and where policy infrastructure has calcified over decades. To the benefit of no one (except those who make up the tails of the distribution), the system excludes — via categorical income limits — the cohort most capable of generating positive fiscal returns, demographic renewal, and family formation: middle-income households.
The authors of the 2024 Harvard JCHS “Subsidizing the Middle” report rightly observe that middle-income housing programs can catalyze construction in market segments that otherwise remain idle, noting that such programs “expand the supply of housing in a way that might not otherwise be practical,” and that by doing so they can relieve pressure on the lower-cost stock. This argument, taken to its logical conclusion, suggests that if the goal is to expand the supply of otherwise uneconomic housing, then existing suboptimal policies must be dramatically reformed. In the final part of this series, we will be laying out exactly what such reforms should entail.
In 2022, IRS released “Average Income Test” regulations allowing LIHTC developments to serve families up to 80% AMI, but only as long as the average income of all residents remains at or below 60% AMI. This means a handful of 80% AMI households can be included, but the program fundamentally serves the bottom income quartile.
As we argued in part two: (1) housing costs directly suppress fertility among high-skill, middle-income households at rates previously underestimated; (2) family formation in this cohort creates superior economic returns relative to poverty-focused or wealth-preserving interventions; and (3) the demographic and fiscal consequences of failing to support this cohort threaten long-term productivity growth and fiscal sustainability.
The Down Payment Toward Equity Act (proposed 2021, reintroduced as the Down Payment Toward Equity Act of 2025) represented an attempt to break this pattern. The bill would have provide $20k in down payment assistance (or 10% of purchase price, whichever is greater) to first-time, first-generation homebuyers earning up to 120% of AMI in standard cost-of-living areas and 140% of AMI in high-cost areas. This was a direct challenge to the 80% threshold, but the bill did not pass.
In Dallas County, for example, a 4-person household earning above ~$52k (50% AMI) is categorically excluded from Section 8, while the median household income for Dallas County is ~$117k. This means families earning $52-93k (roughly 50-80% AMI) receive no housing assistance.
Examples include New York’s Mitchell-Lama program (over 100,000 units still in operation) and Massachusetts’s Workforce Housing Initiative, which provides up to $100,000 in subsidy per unit for households at 60-120% AMI. More recently, Washington D.C. proposed a $20 million Workforce Housing Fund, and individual cities like San Marcos, Texas have established teacher and public employee housing preferences up to 140% AMI.
Across the entire country, workforce housing programs collectively serve fewer households annually than LIHTC serves in a single state. The aggregate investment in workforce housing is a rounding error compared to low-income housing tax credits or Section 8 vouchers.
Per Sam Deutsch in Everything You Need to Know About Inclusionary Zoning:
Anti-housing officials and advocates are well aware that inclusionary zoning requirements can make many housing projects unviable. And smart NIMBYs know that elected officials are becoming more dismissive of specious anti-housing arguments around “neighborhood character” and “shadows”. So, they view excessive inclusionary zoning requirements as a popular, socially acceptable way to stop denser housing development. This can be seen in wealthy suburbs like Mamaroneck and Temple City where anti-housing legislators knowingly use excessive inclusionary zoning mandates to block all new housing.
Stacy et al. (2023) documented IZ laws in 886 jurisdictions across 25 states as of 2016, and found that mandating below-market unit shares in all new development typically functions as a hard constraint by rendering new construction economically infeasible. The effects are especially pronounced in markets where supply is already tight.
One might ask who bears the cost; it depends on how the IZ law is structured. Some below-market-rate housing is targeted at middle-class people making 80%-120% the median income in an area, and requires a relatively small subsidy. But most below-market-rate housing is for those making less than 60% (sometimes even less than 30%) the median income and requires a greater subsidy. In the latter instances, it’s middle-income households — who can neither access set-asides (reserved for lower-income households) nor afford inflated market rents created by IZ taxes — that bear the cost.
Means and Sirtingham (2012) found that in California, IZ reduced supply by 7% and increased market-rate prices by 20% between 1990 and 2000. Even the celebrated Montgomery County, MD program — forty years old and often hailed as a model for IZ — reveals the policy’s fundamental limitations. While producing approximately 10,781 units through 1999, only 3,805 remained governed by affordability restrictions. For a county approaching one million residents, this represents roughly one preserved affordable unit per 260 residents after four decades — hardly the transformative intervention advocates claim.
This data is also corroborated by a later HUD-sponsored case study by The Urban Institute (2012) comparing Montgomery County and Fairfax County programs, which documented that “from 2000 to 2011, MPDUs represented only 6.6% of all issued building permits” despite the program being “nationally recognized as one of the most successful IZ ordinances.”
Additional work by Bento et al. (2009) demonstrates that IZ causes prices to rise 2-3% faster in California jurisdictions compared to those without IZ, while decreasing single-family home starts and reducing average unit sizes as developers be substitute away from market-rate production toward smaller units. Schuetz, Meltzer, and Been (2011) show the same pattern around Boston: higher prices, lower production.
The numbers surrounding the several major rent-controlled markets are staggering:
NYC and LA together account for roughly 1.6–1.7 million regulated units, well over 80% of all rent‑controlled apartments nationally
NYC has 24k rent-controlled and ~960k rent-stabilized apartments, comprising roughly 41% of all city rentals
LA has 650k units subject to the city’s Rent‑Stabilization Ordinance (RSO), or about 2/3rds of rental households
SF rent control covers more than 60% of all rental units (buildings with certificates of occupancy dated before June 13 1979)
DC rent control covers roughly 36% of units (2019 estimate)
Additionally, 1 in 5 municipalities in New Jersey enforce local rent-control ordinances. Oregon and Maine also both have statewide rent‑control frameworks adopted in 2019 and 2023, respectively, that cap annual increases — Oregon: 7 % + CPI; Maine: municipal opt‑ins.
In a joint study in 2022, the National Association of Home Builders and the NMHC asked multifamily developers whether they avoid building new properties in jurisdictions with rent control. An overwhelming majority, 87.5%, said yes.
Other research — notably the 2017 New York City Housing and Vacancy Survey — finds that while 93 cents of every rent dollar goes toward operational costs, when rents are capped landlords cannot recoup these costs, forcing them to choose between reducing maintenance or exiting the market. In NYC, 64% of rent-controlled units had maintenance deficiencies compared to 47% of unregulated units, and rent-controlled units were more than twice as likely to have three or more major maintenance issues (18% vs 7.5%) even after adjusting for building age.
Filtering links the physical durability of housing with its economic life cycle. when new supply hits the top of the market, the bottom of the market is refreshed — as dwellings age and depreciate, they gradually “filter” down the housing stack, eventually becoming affordable to middle- and eventually lower-income households. Instead of centrally-planned or -mandated affordability, the mechanism behind filtering is chains of migration.
Though supply skeptics and policymakers in blue cities often dismiss this phenomenon as a neoliberal fiction, treating market-rate (and “luxury”) development as irrelevant to affordability, the empirical record tells a different story.
Rosenthal’s (2014) longitudinal study of census data found annual filtering rates of 2.5% for rentals and 0.5% for owner-occupied homes, meaning a meaningful share of the affordable housing stock originates as yesterday’s market-rate construction. Been et al. (2019) documented that 23.4% of affordable rental units in 2013 had filtered down from higher-rent categories since 1985, with faster filtering in areas with fewer regulatory restrictions. Most compellingly, Mast’s (2023) migration chain analysis tracing 52,000 movers across twelve North American cities showed that every 100 new market-rate units ultimately free up 45–70 below-median units within five years.
These affordability gains occur through the dynamic turnover of people and housing stock. However, rates of within-unit filtering are not constant; local housing-market conditions can meaningfully alter the pace and direction of the process. Other recent work — namely Liu et al. (2022) — has explored this heterogeneity shows just how city-specific filtering can be. In DC, and LA, the filtering pattern actually happens in reverse: as units age, they are occupied by higher-income residents:
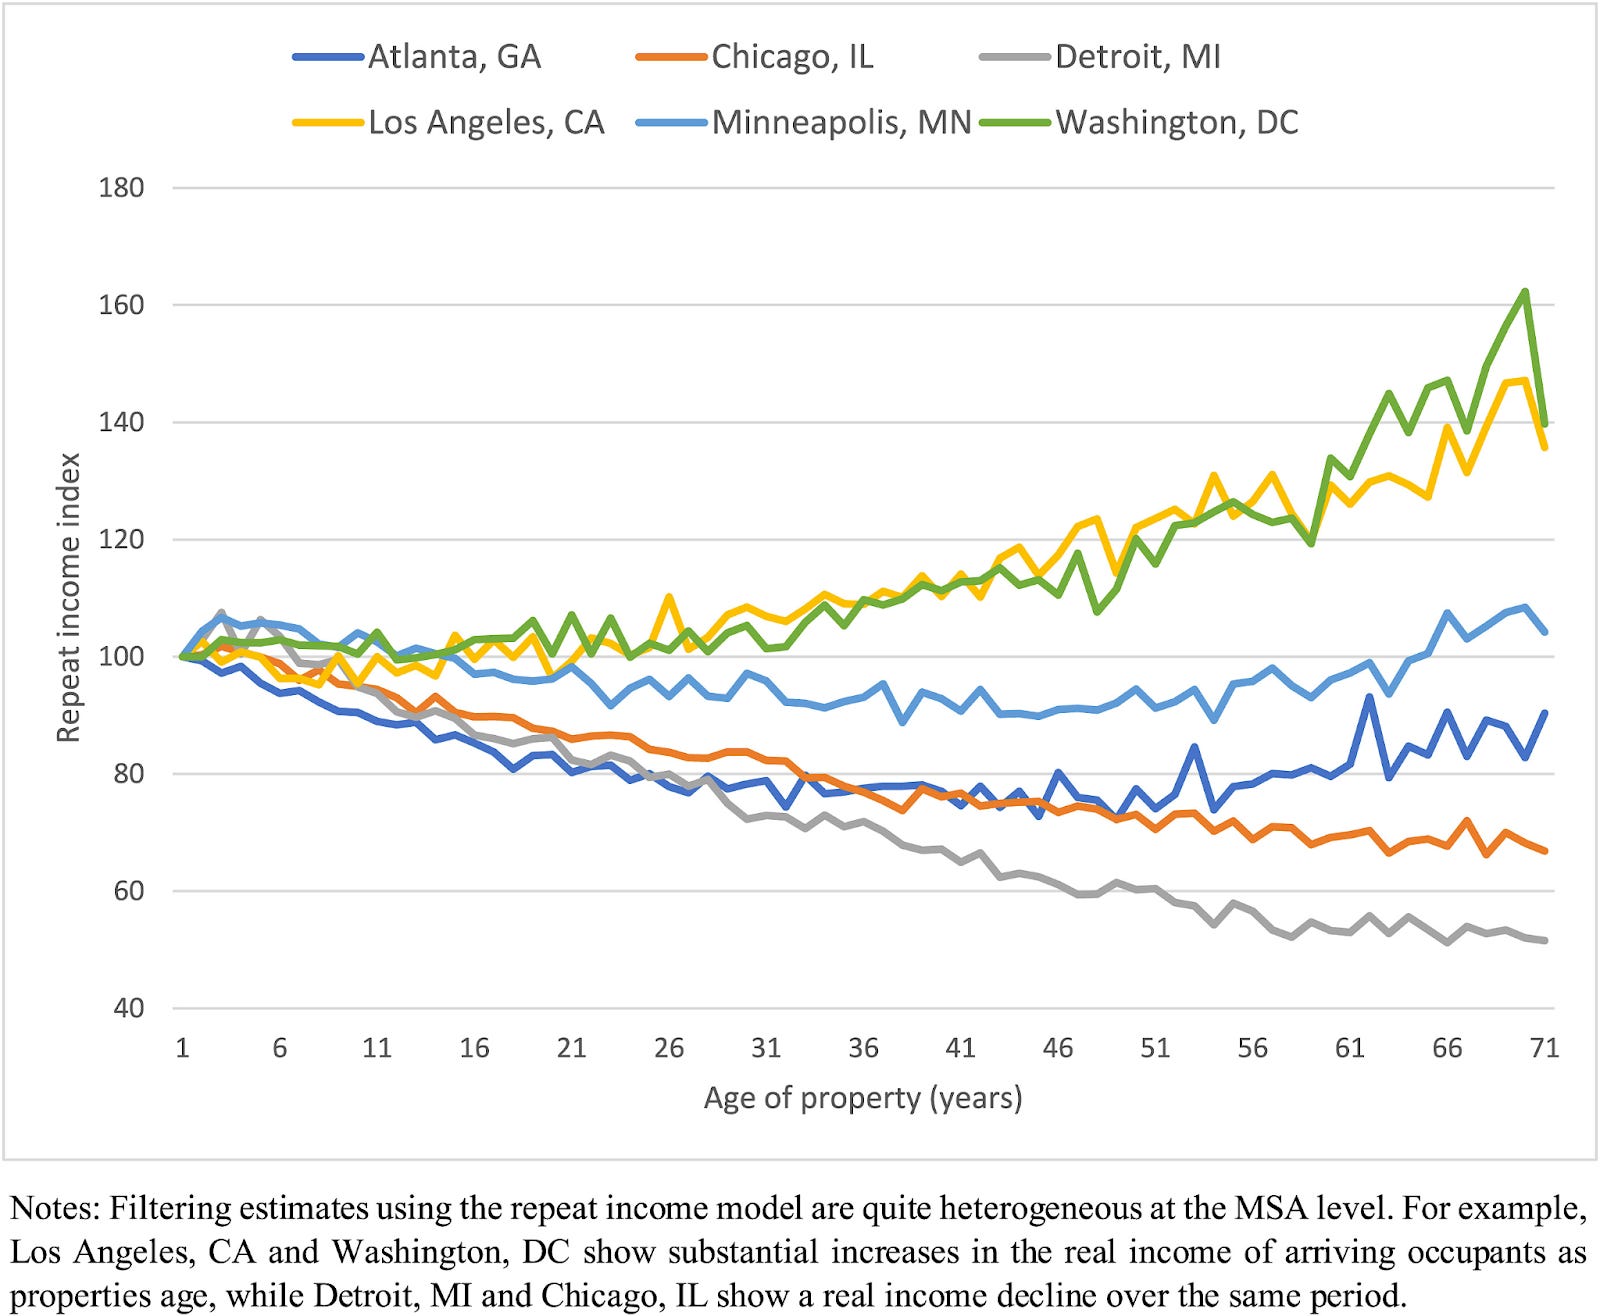
The Liu et al. (2022) paper also documents a negative relationship between filtering speed and regulatory stringency: tighter zoning and land-use rules are associated with weaker, slower downward filtering. So in all likelihood, the filtering process freezing or even reversing is an indicator of substantial frictions in a given housing market.
It is estimated that NOAH comprises 85% of affordable units in Houston.
When NOAH properties change hands or undergo renovation, they are frequently upscaled into luxury rentals, displacing middle-income tenants with rent increases of 50-100% or more. Philadelphia provides a cautionary case study: between 2008 and 2016, the city lost 13,000 lower-cost units while adding 6,000 at the high end of the market.
Yet, that "advocacy infrastructure” will never differentiate those who are truly unable to help themselves and those who choose not to help themselves. The first group is very small relative the total, but that fact cannot be acknowledged as it would put the advocacy infrastructure out of business.
Poverty is bad, not people who are impoverished. Policies should seek to lift the impoverished, not entrench them