

Which Party is 'Better' on Housing Regulations?
What the data actually says.


Introduction:
Today, in our effort to establish “ground truth,” around housing we wanted to dig into: land use regulations.
When reading academic or popular research around the topic of housing, these restrictions—such as limits on the size of buildings—are by far the most commonly identified friction keeping markets from achieving an equilibrium between supply and demand. They are, of course, not the only driver of home prices; dynamics such as crime avoidance or educational quality are also very central, but strict regulations around building new housing are extremely important.
With that in mind, we wanted to see what the data actually says. Specifically, in this article I will answer the following common questions:
What does the geography of land use regulation actually look like?
Is there a partisan angle here? Namely, does there seem to be a clear relationship with either party at the state or local level?
Are stricter land use regulations associated with higher prices, and affordability more generally?
Before we proceed, I want to ask you: Do you think there is a partisan angle, and if so, which party is ‘better’?

Summary:
In short, here are the answers to those questions. I have more maps, graphics, and explanations of the data later in the article, so consider this only a preview.
People’s anecdotal priors—that the Northeast and West have the most strict land use regulations—are true. When measured at the metro level, the top 5 cities with the strictest land use laws1 are, in order: Santa Rosa, San Francisco, New York, San Jose, and Providence, RI.
Additionally, although states like Texas do relatively well, their metros lag behind smaller cities like Augusta, Maine (the least restrictive city), and Muskegon, Michigan (2nd place).
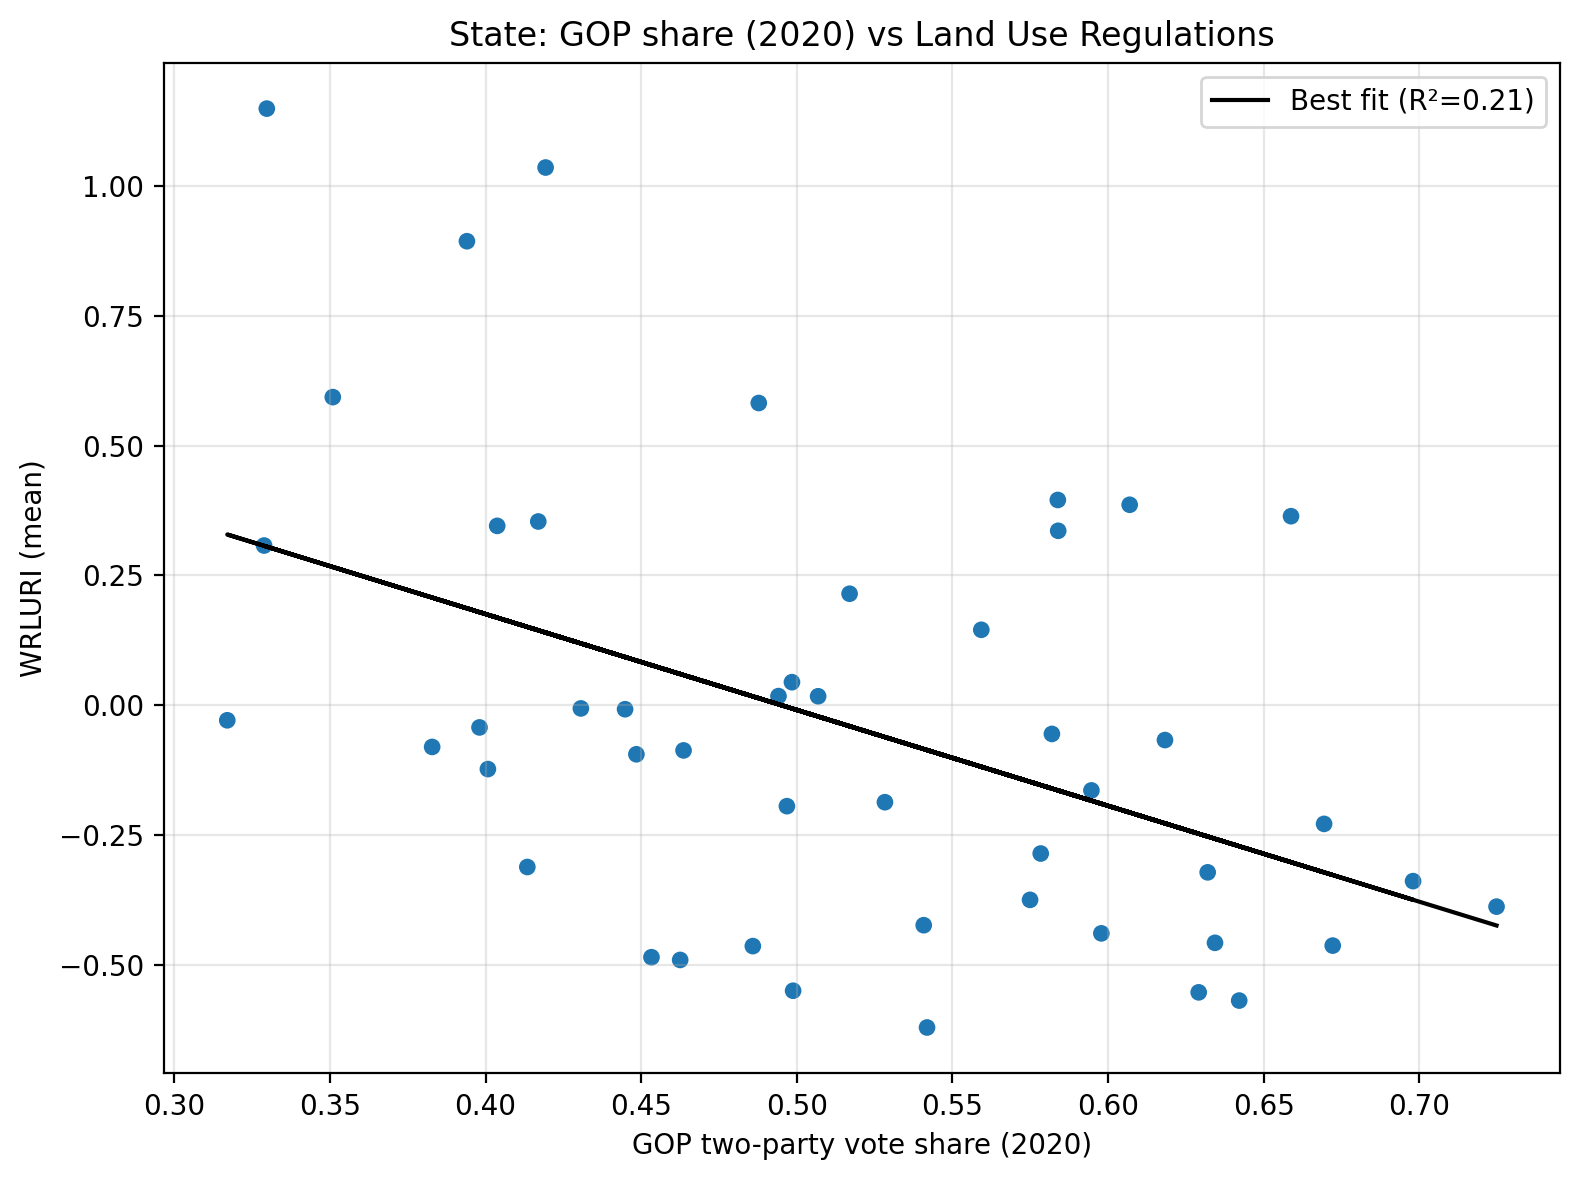
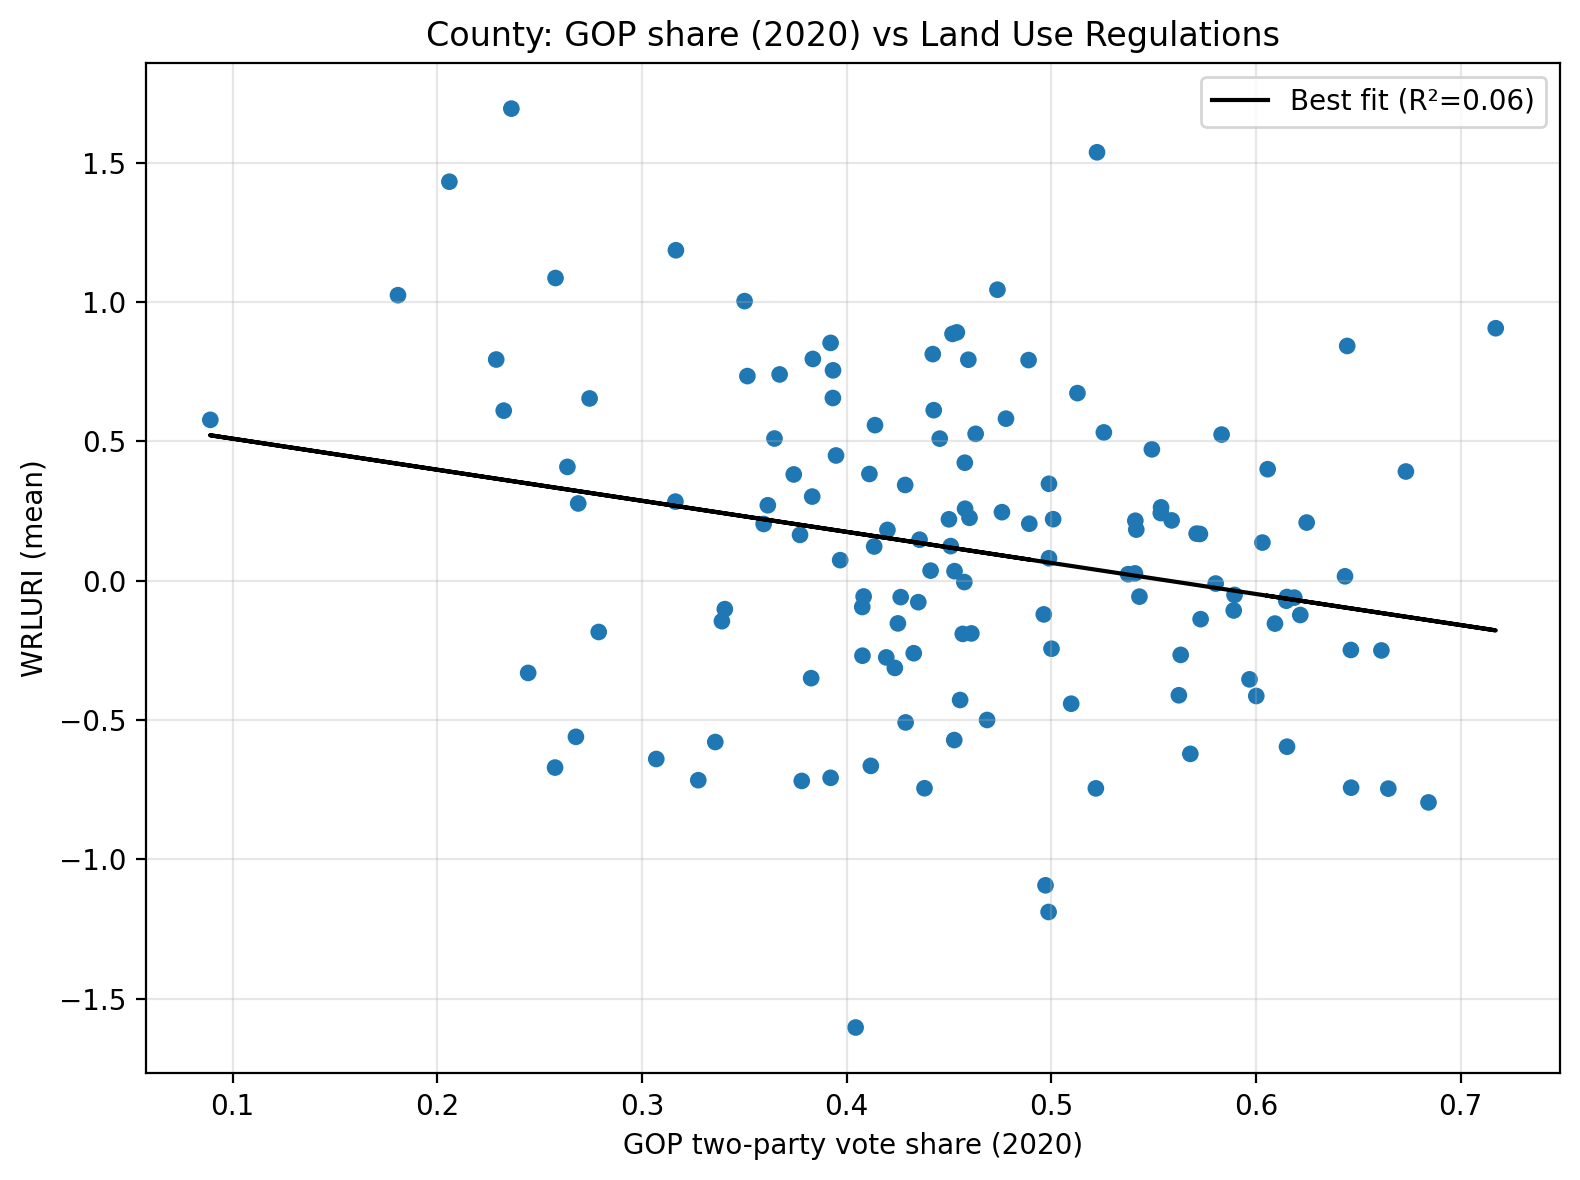
Yes, there is a clear partisan dynamic. When measured at the state or county level, more Democrat voters are positively associated to the more land use regulation.
This isn’t particularly surprising given the Republican Party’s traditional role as the party of deregulation, but the relationship is evident. Note: more Republican states/counties are cheaper when measured in absolute terms AND when costs are measured relative to income.
Again, unsurprisingly, yes—stricter land use regulations is strongly related to less affordability. This is true when measured in both absolute and relative terms, as well as when examining county and state patterns.
When taken together, it appears that the argument—that stricter land use regulations are an important driver of housing costs and that Republicans are better on them—has strong empirical evidence. It remains to be seen if Abundance as a movement can reverse this.
What are Land Use Regulations?
Land use regulations are the rules and procedures local governments use to control how land can be developed. They shape everything from how dense a neighborhood can be, to how long it takes to get a building permit approved, to whether a developer must provide open space or affordable units in exchange for the right to build.
In more heavily regulated areas, projects can require sign-off from three or more different entities, minimum lot sizes of two acres or more, open space mandates, impact fees, and review times stretching to eight months or longer.
Data:
Naturally, comparing the intensity of one region’s regulations to another is not an easy task, and rather than trying to reinvent the wheel, we are instead relying on the “Wharton Residential Land Use Regulation Index (WRLURI),” which is widely used in the academic literature. If you want to read more about how this data is constructed, I invite you to read Joseph Gyourko, Jonathan Hartley, and Jacob Krimmel’s paper “The Local Residential Land Use Regulatory Environment Across U.S. Housing Markets: Evidence from a New Wharton Index,” where they go over everything in exhaustive detail. Their most up to date data is from 2020.
There are a couple of important caveats about this data that informed readers should be aware of before we really get our hands dirty.
First, the index is created by combining many different measures of land use regulation to try to compare apples to apples across jurisdictions. To aid interpretability, they have also made the choice to present the index as a measure with a mean of zero and a standard deviation of one, where a higher value represents more regulation. This means the measure only captures a relative and aggregated, not an absolute or objective, levels of regulatory friction.
Second, WRLURI is created by asking local officials about their rules, and so it has serious gaps. In total, 2,450 primarily suburban communities answered the survey, of which ~90% were located within a Core-Based Statistical Area, essentially a metro region. This makes assessing the exact coverage difficult, and all our results should be taken with a suitable grain of salt.
These important notes aside, WRLURI continues to be the gold standard for this type of question, and tragically, there is no true census of land use regulation in this country.
In addition to WRLURI data, I will also be using American Community Survey (ACS) data to estimate rental, home value, and income data. If you want to know more about the advantages and disadvantages of that dataset, I recommend you check out our previous article on the history of housing costs in America.
Finally, for voting outcomes I will be relying on MIT’s Election Lab for the 2020 election results at both the state and county level. I use the 2020 presidential election so as to match WRLURI.
Analysis:
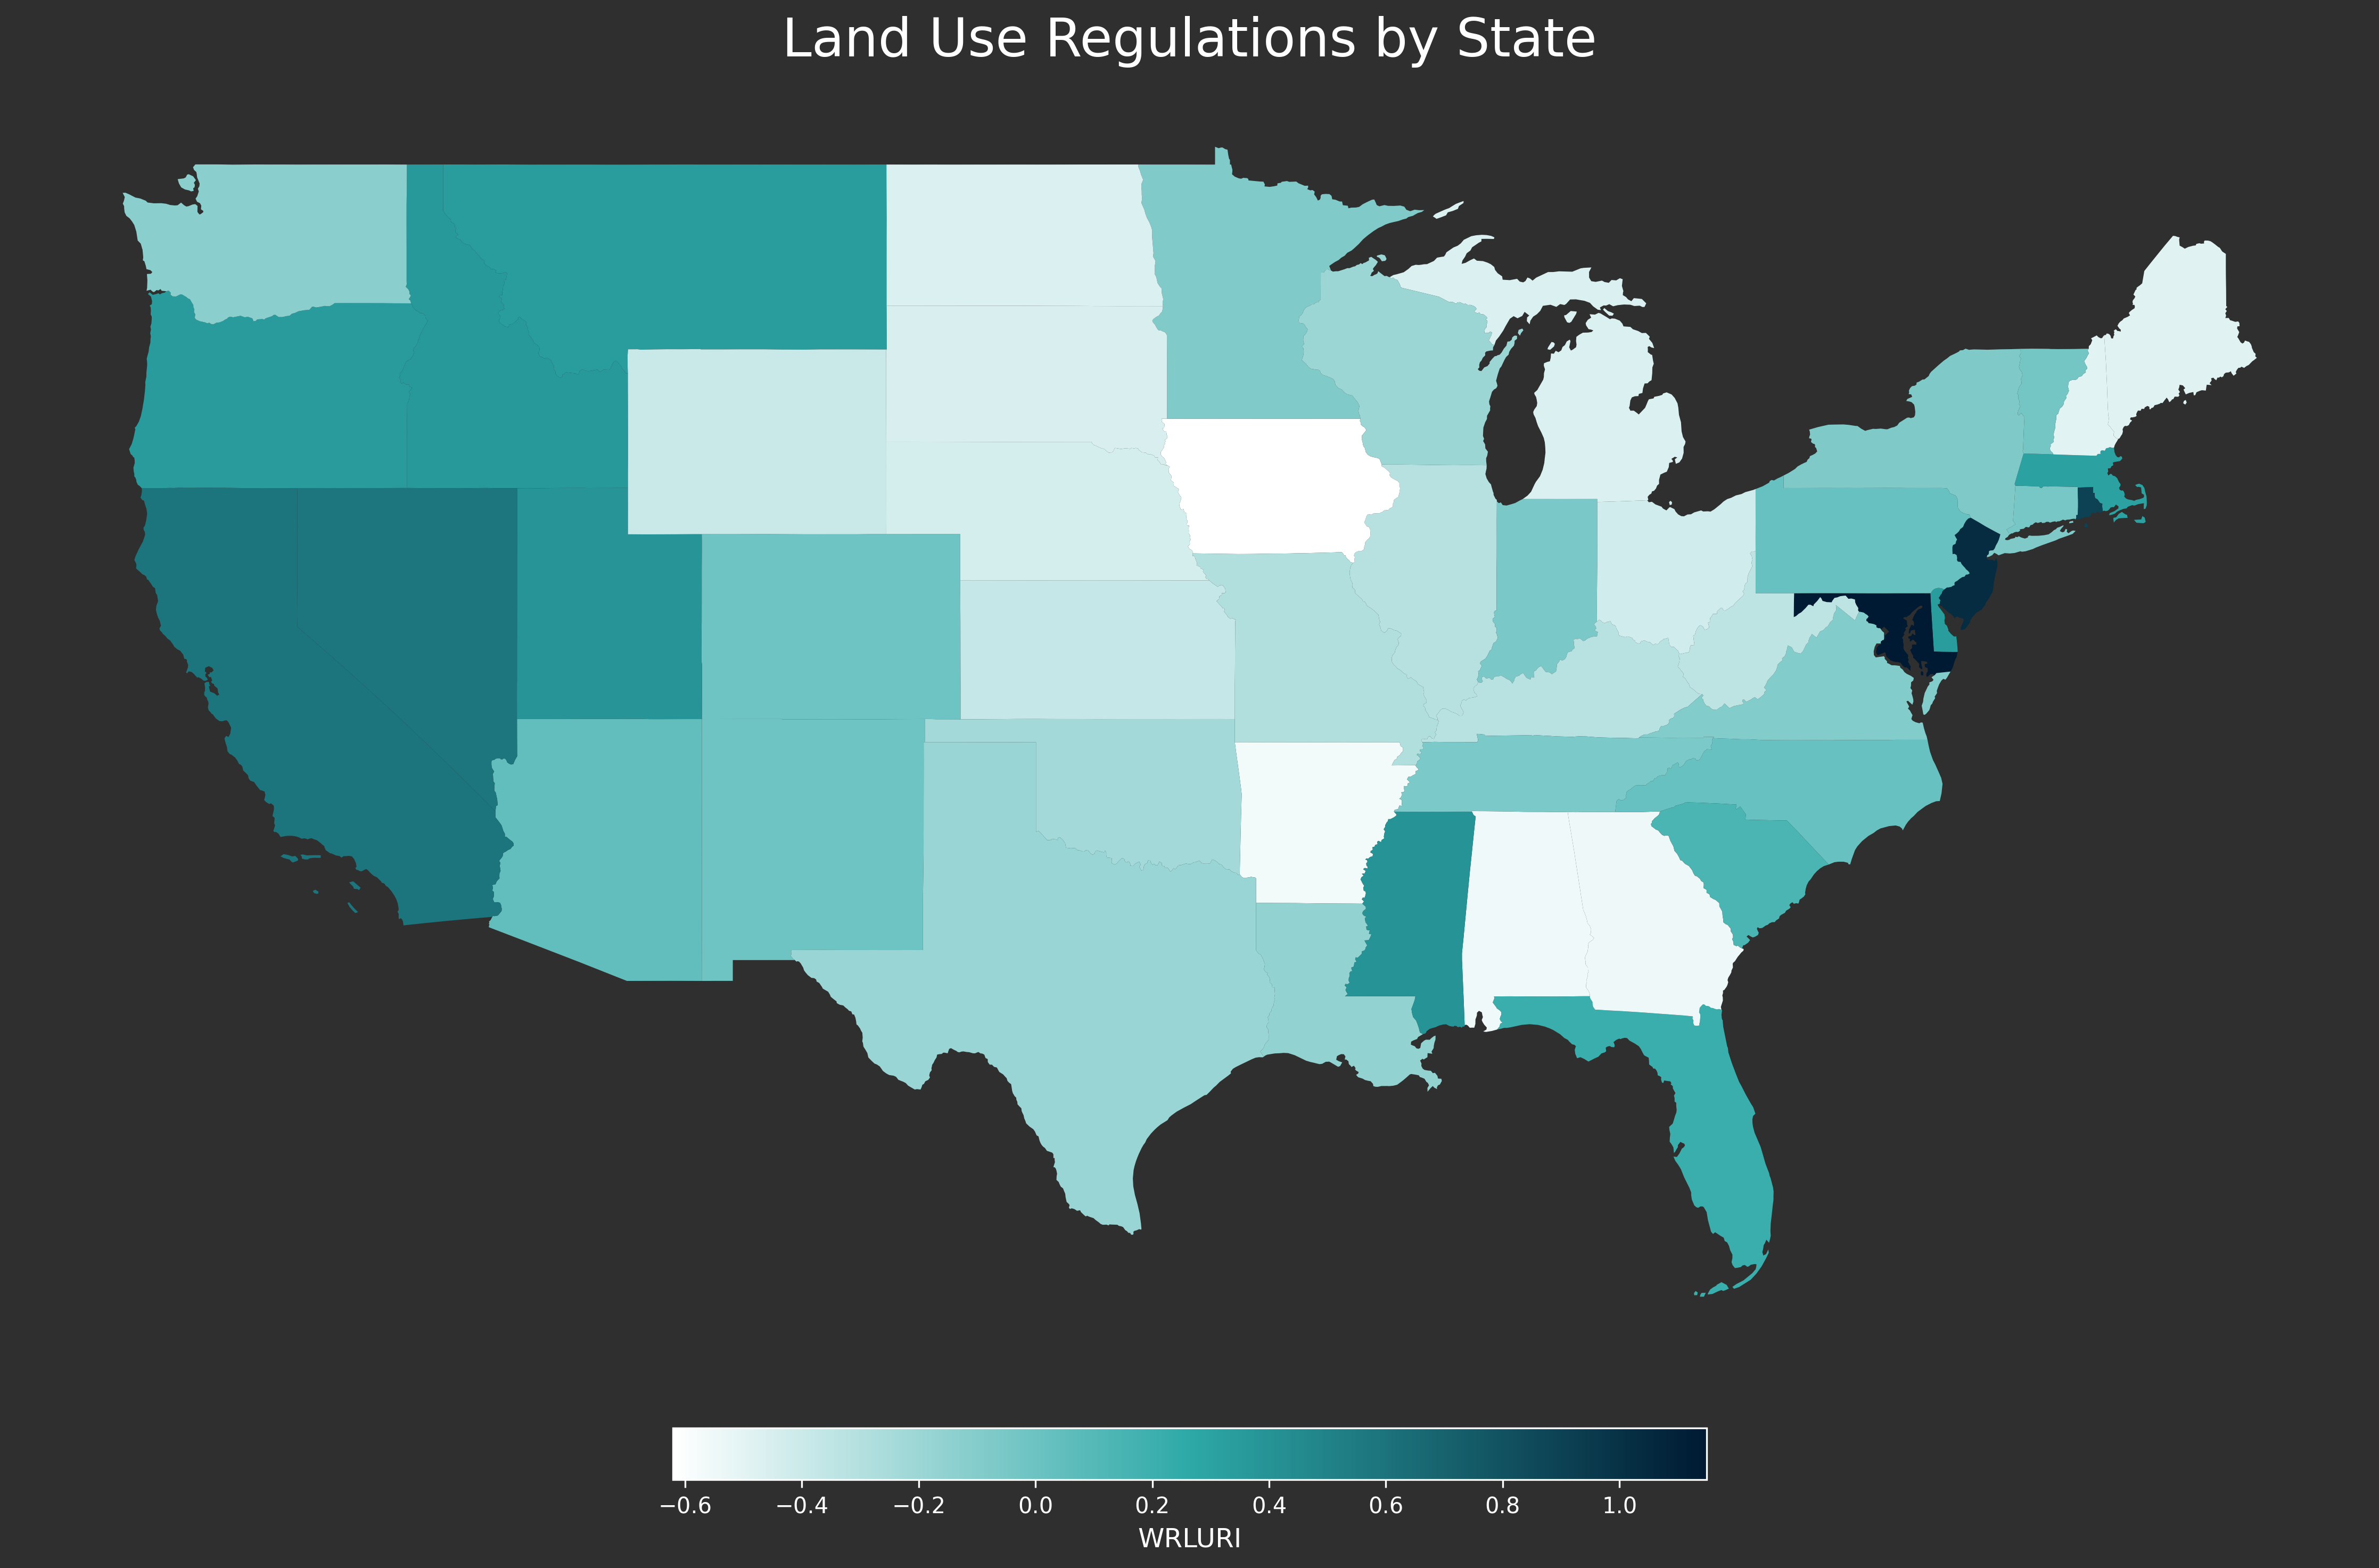
Maps:
This map represents the average of all observations within a state.
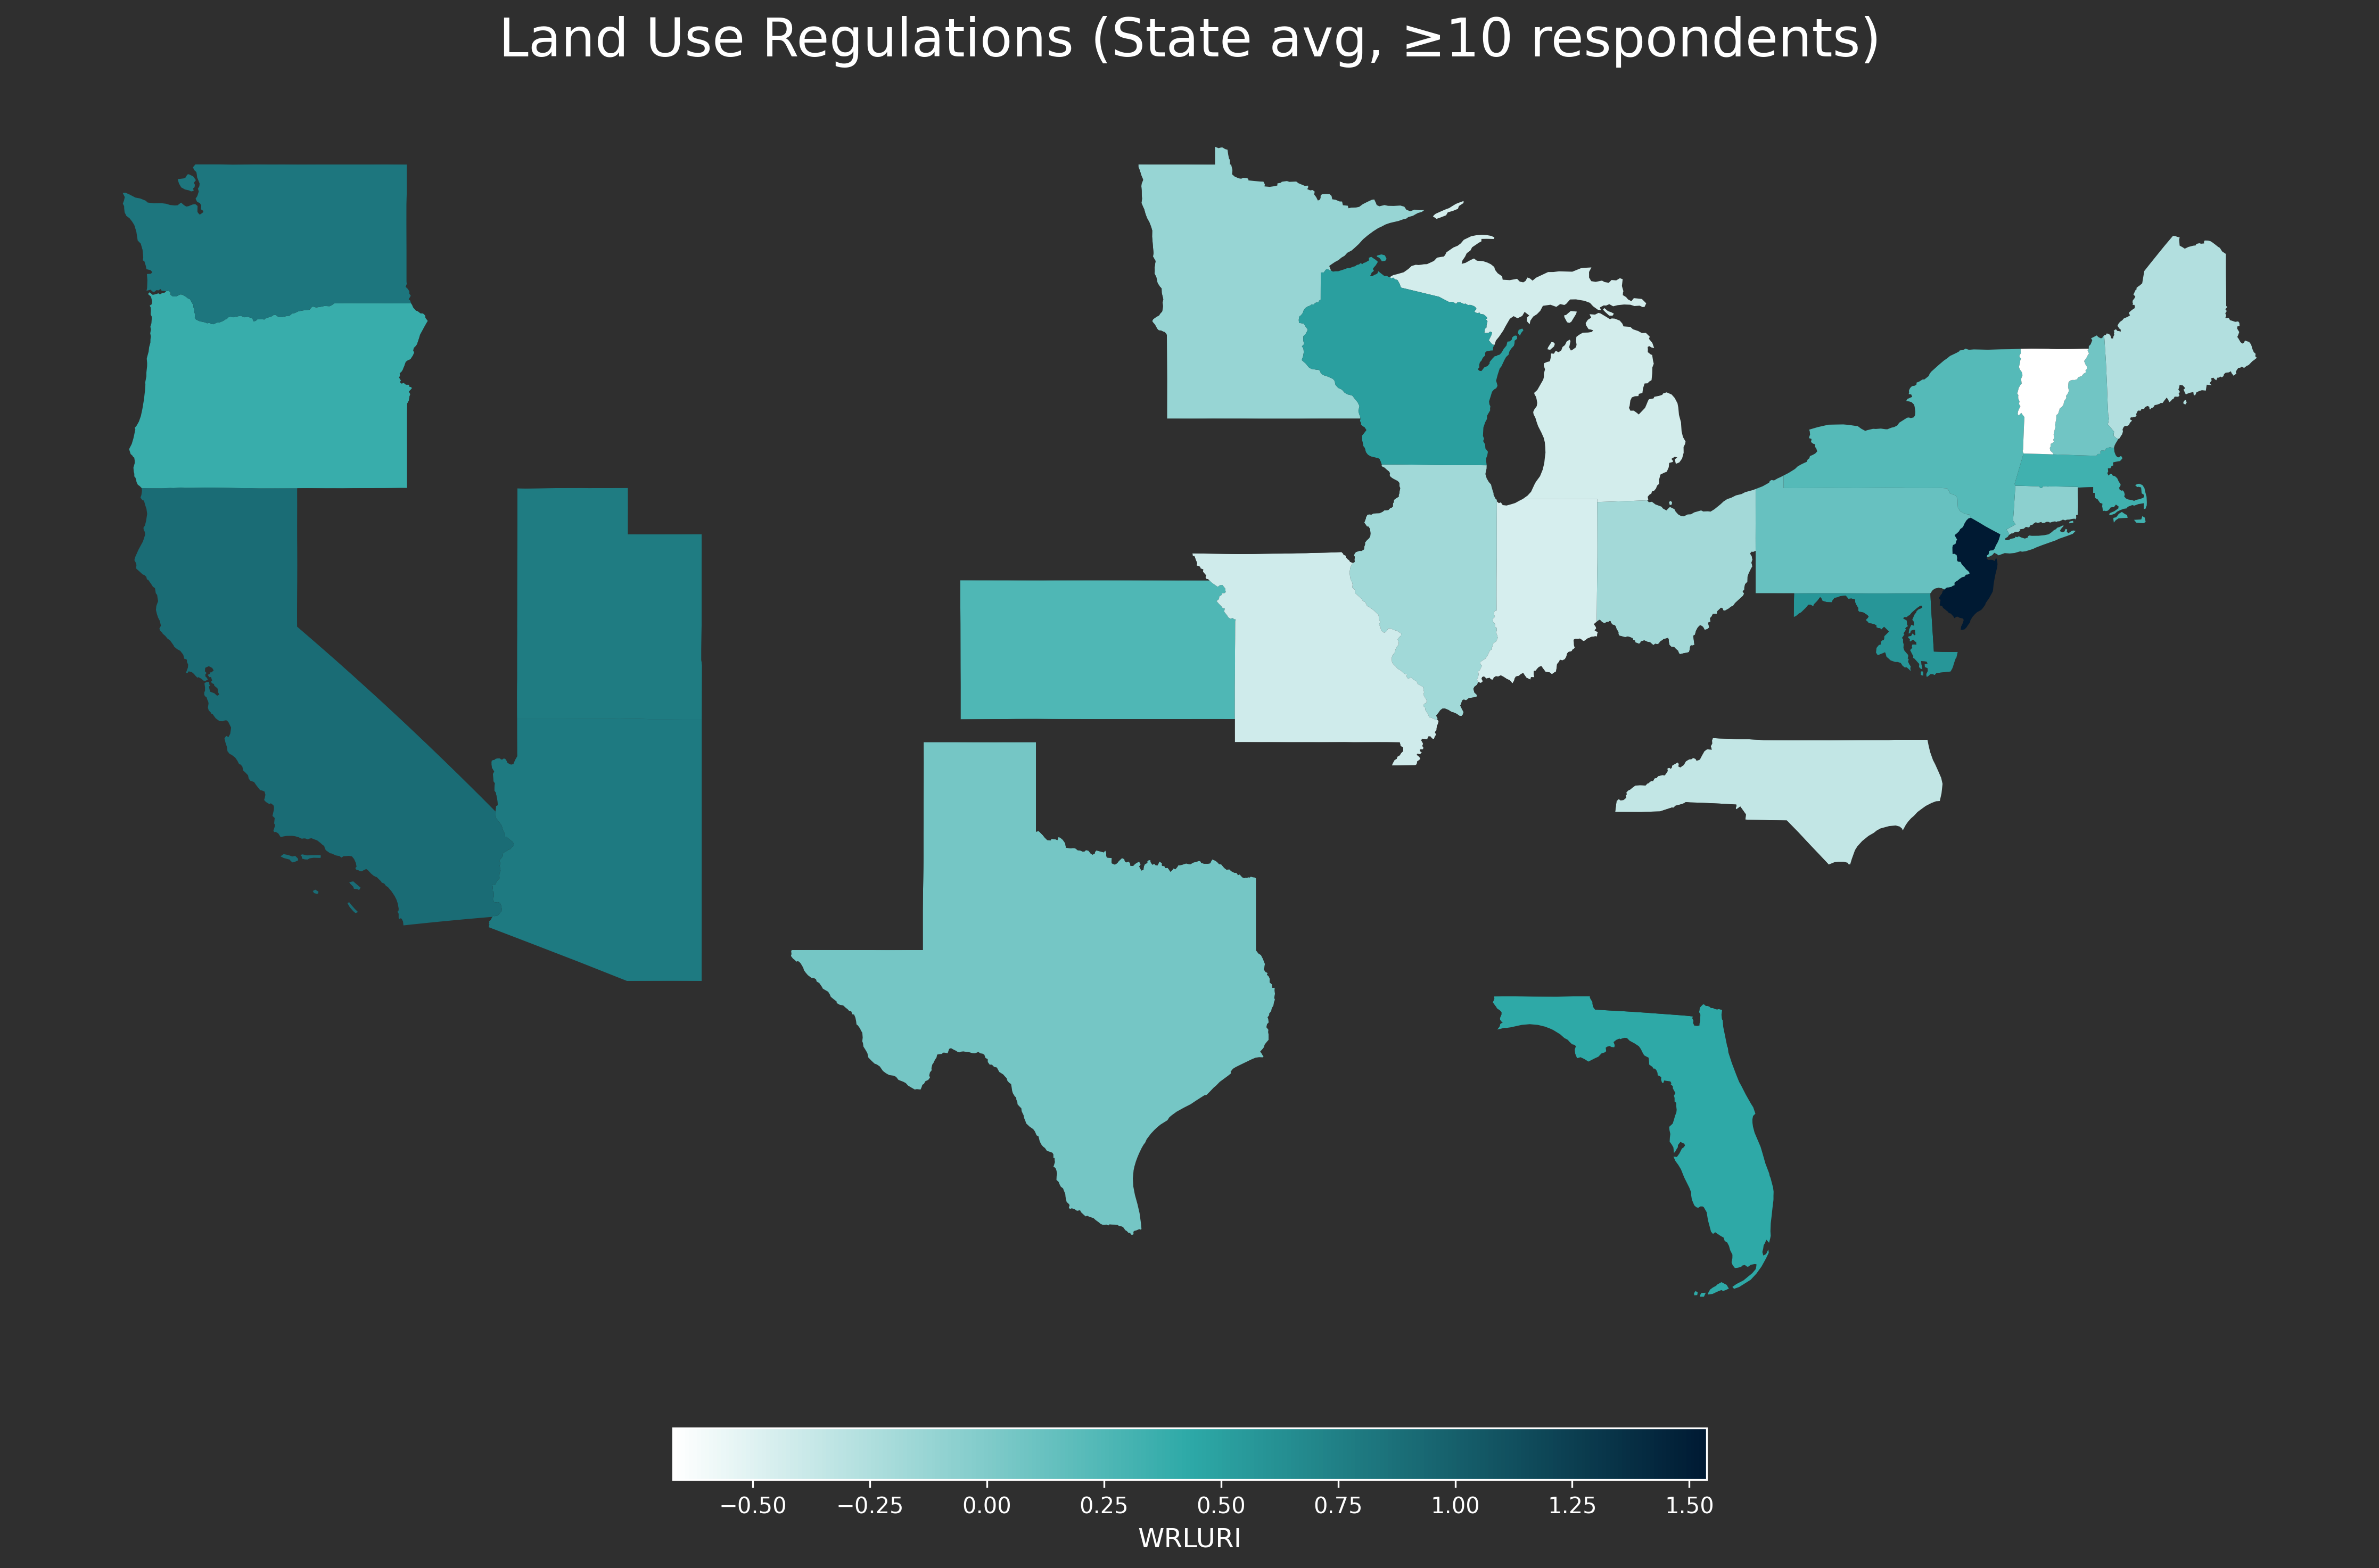
Restricting states to only those with more than 10 respondents gives the following map. Notably many smaller and southern states are dropped.
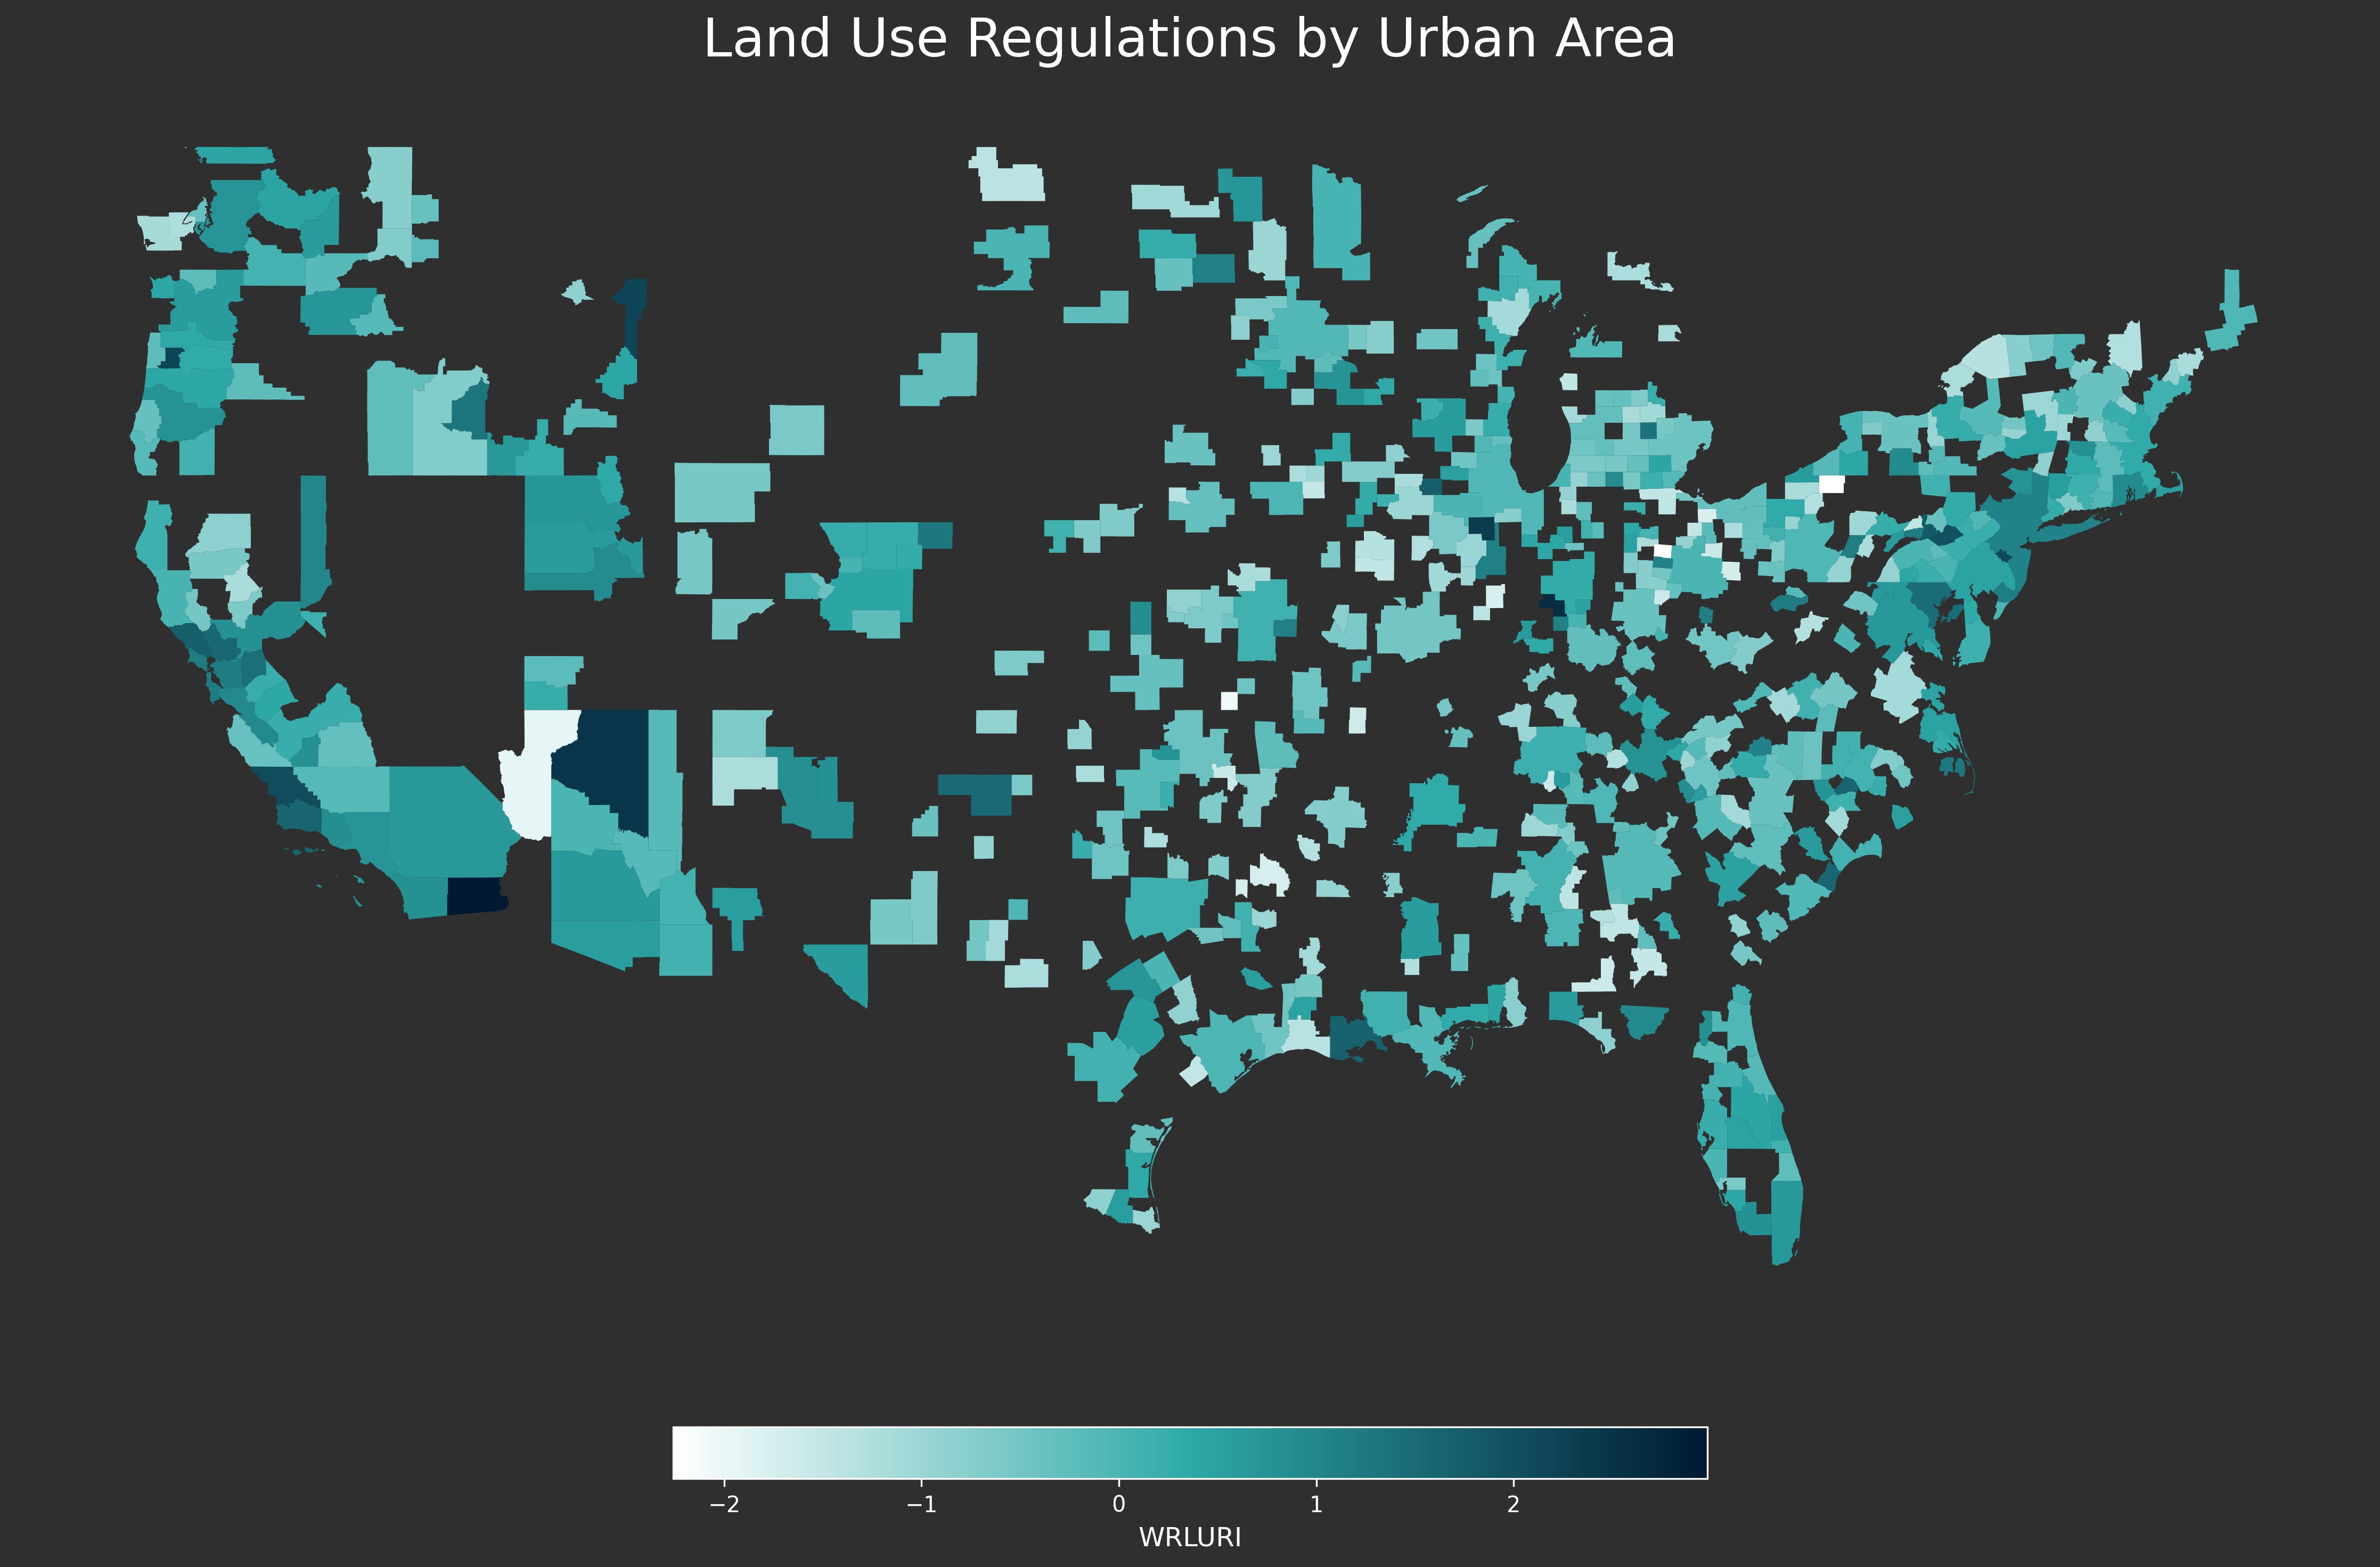
Now zooming the analysis in to CBSA’s or urban areas gives the following dynamic. Again the Northeast and California jump out.
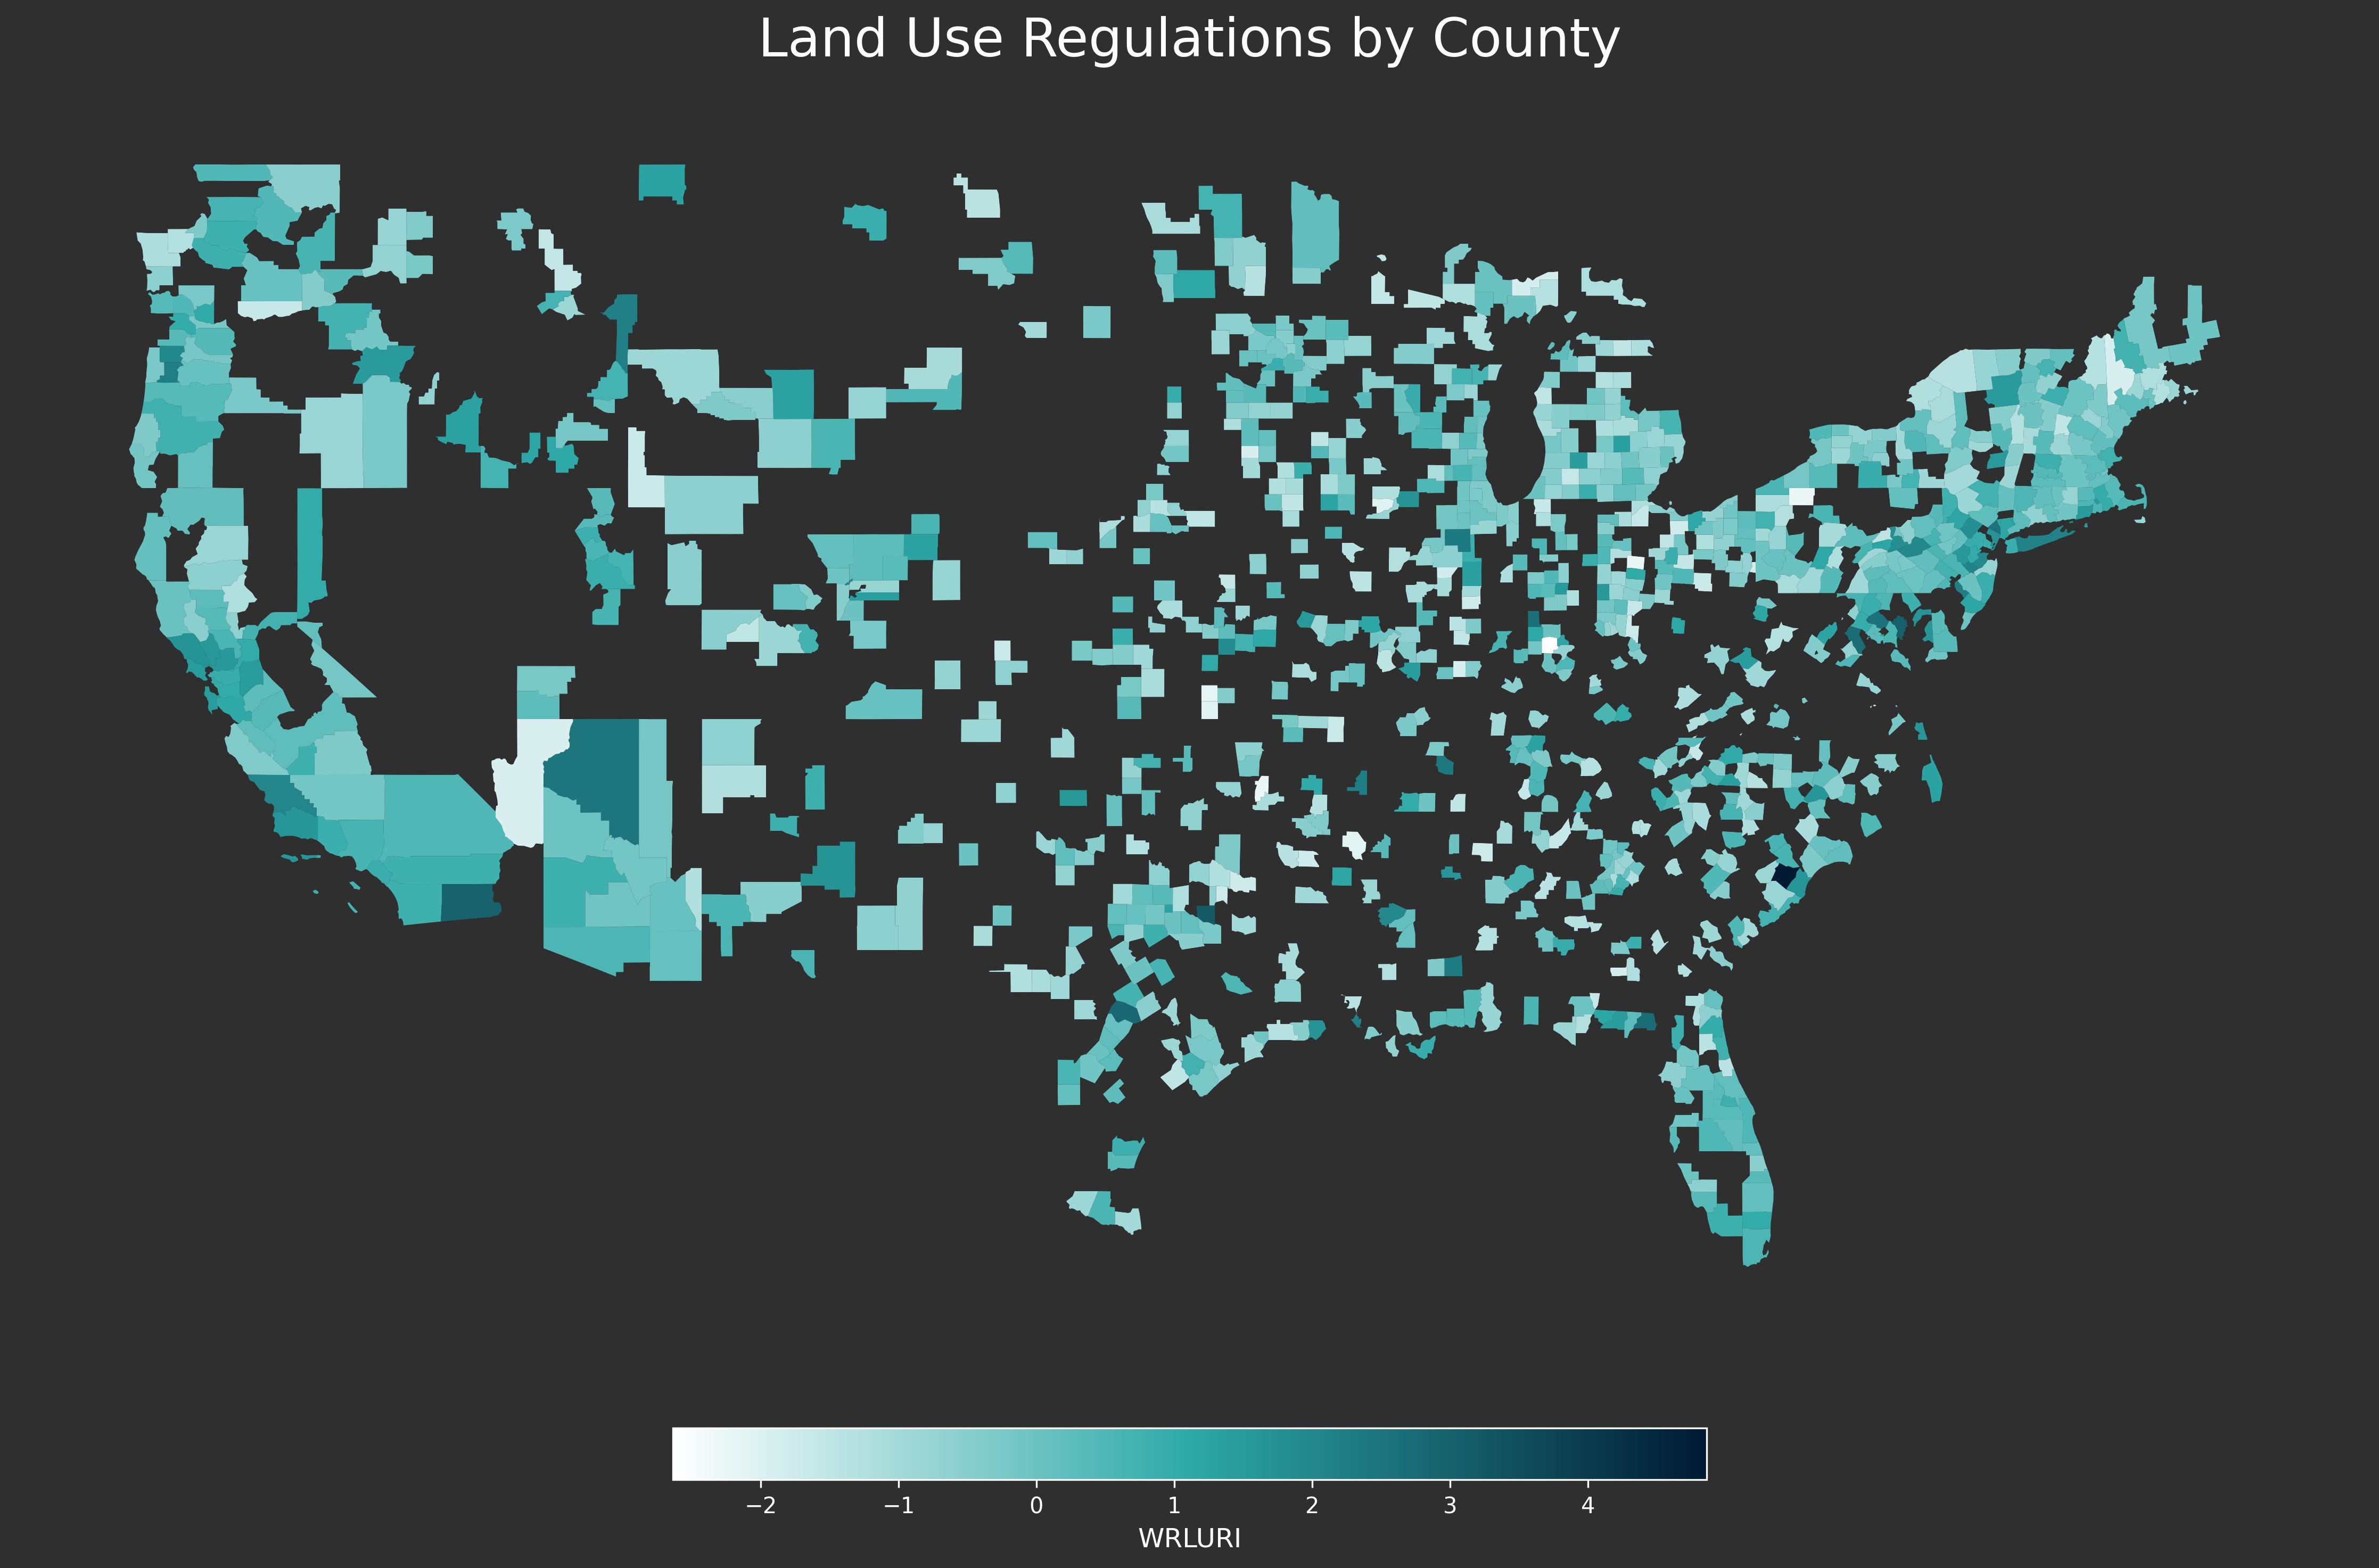
Zooming in even more and examining the data at the county level gives the following analysis.
Graphs:
When measured anyway and at any level, in terms of rents or home values, absolute costs, or costs relative to income, stricter land use regulations are strongly associated with higher housing costs.
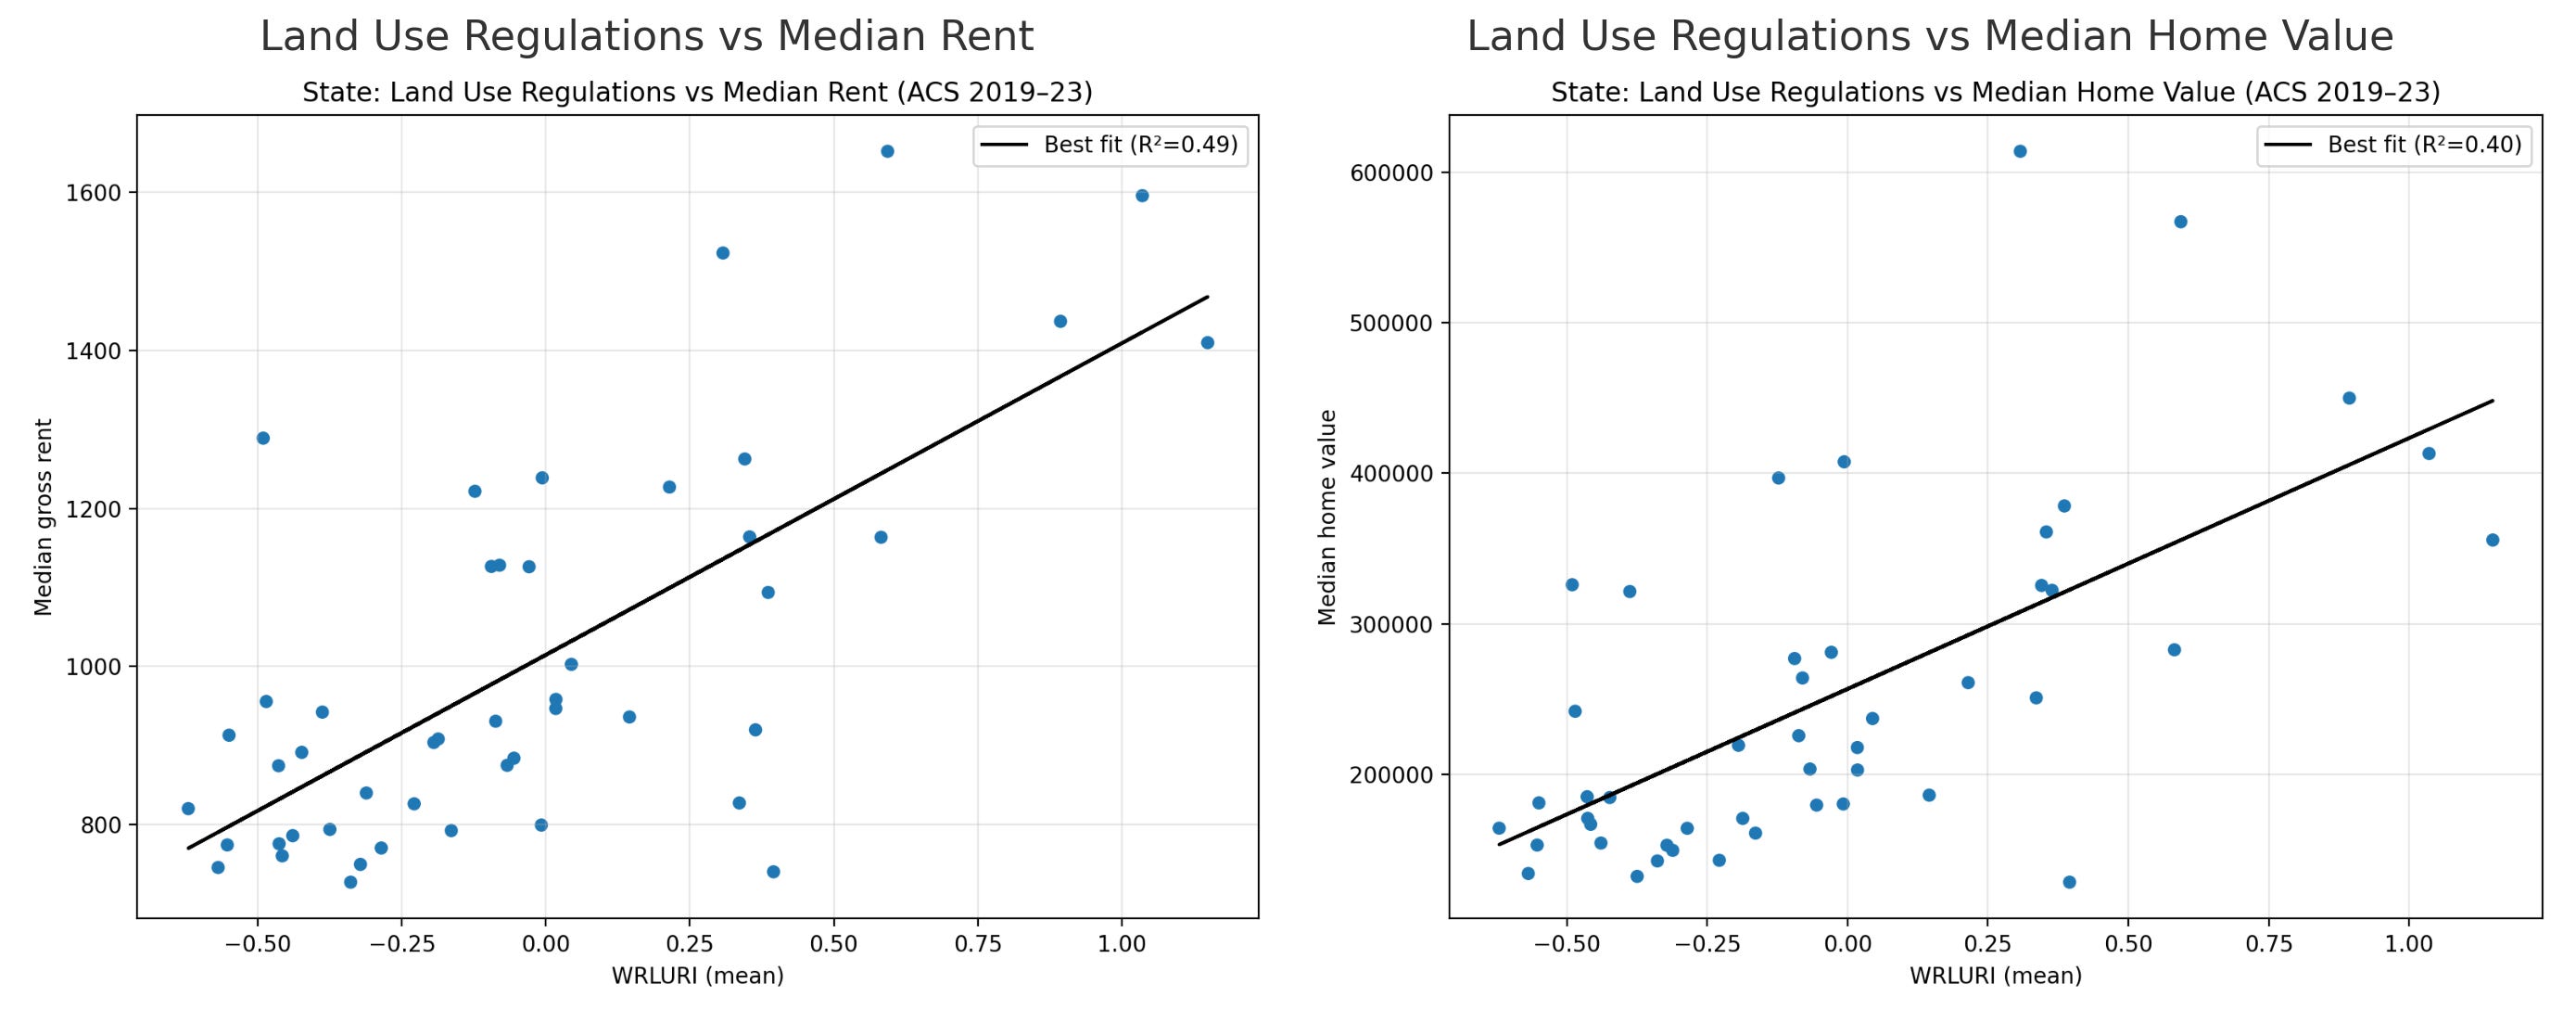
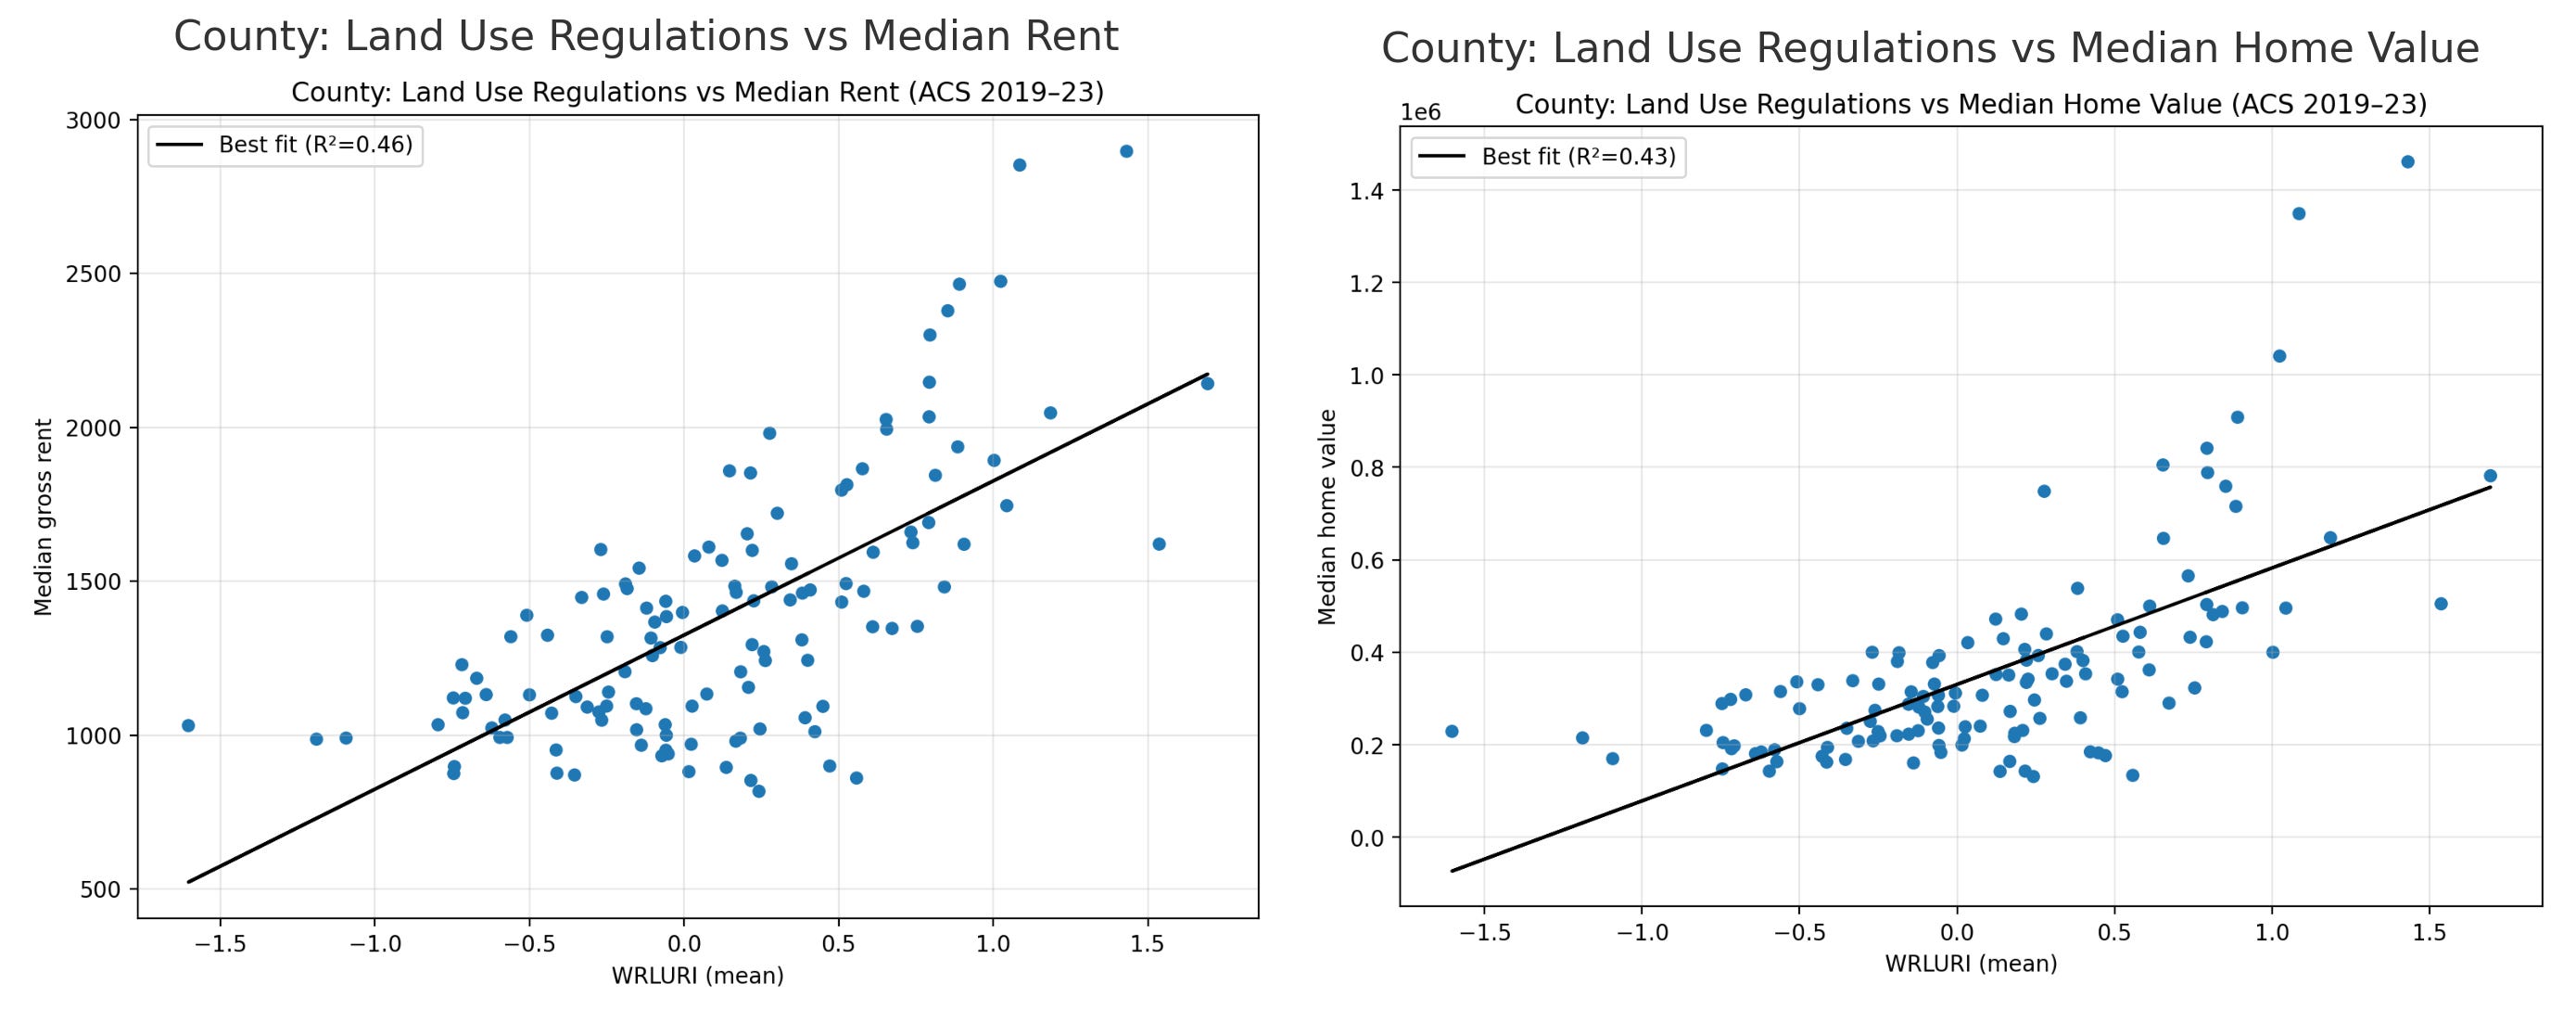
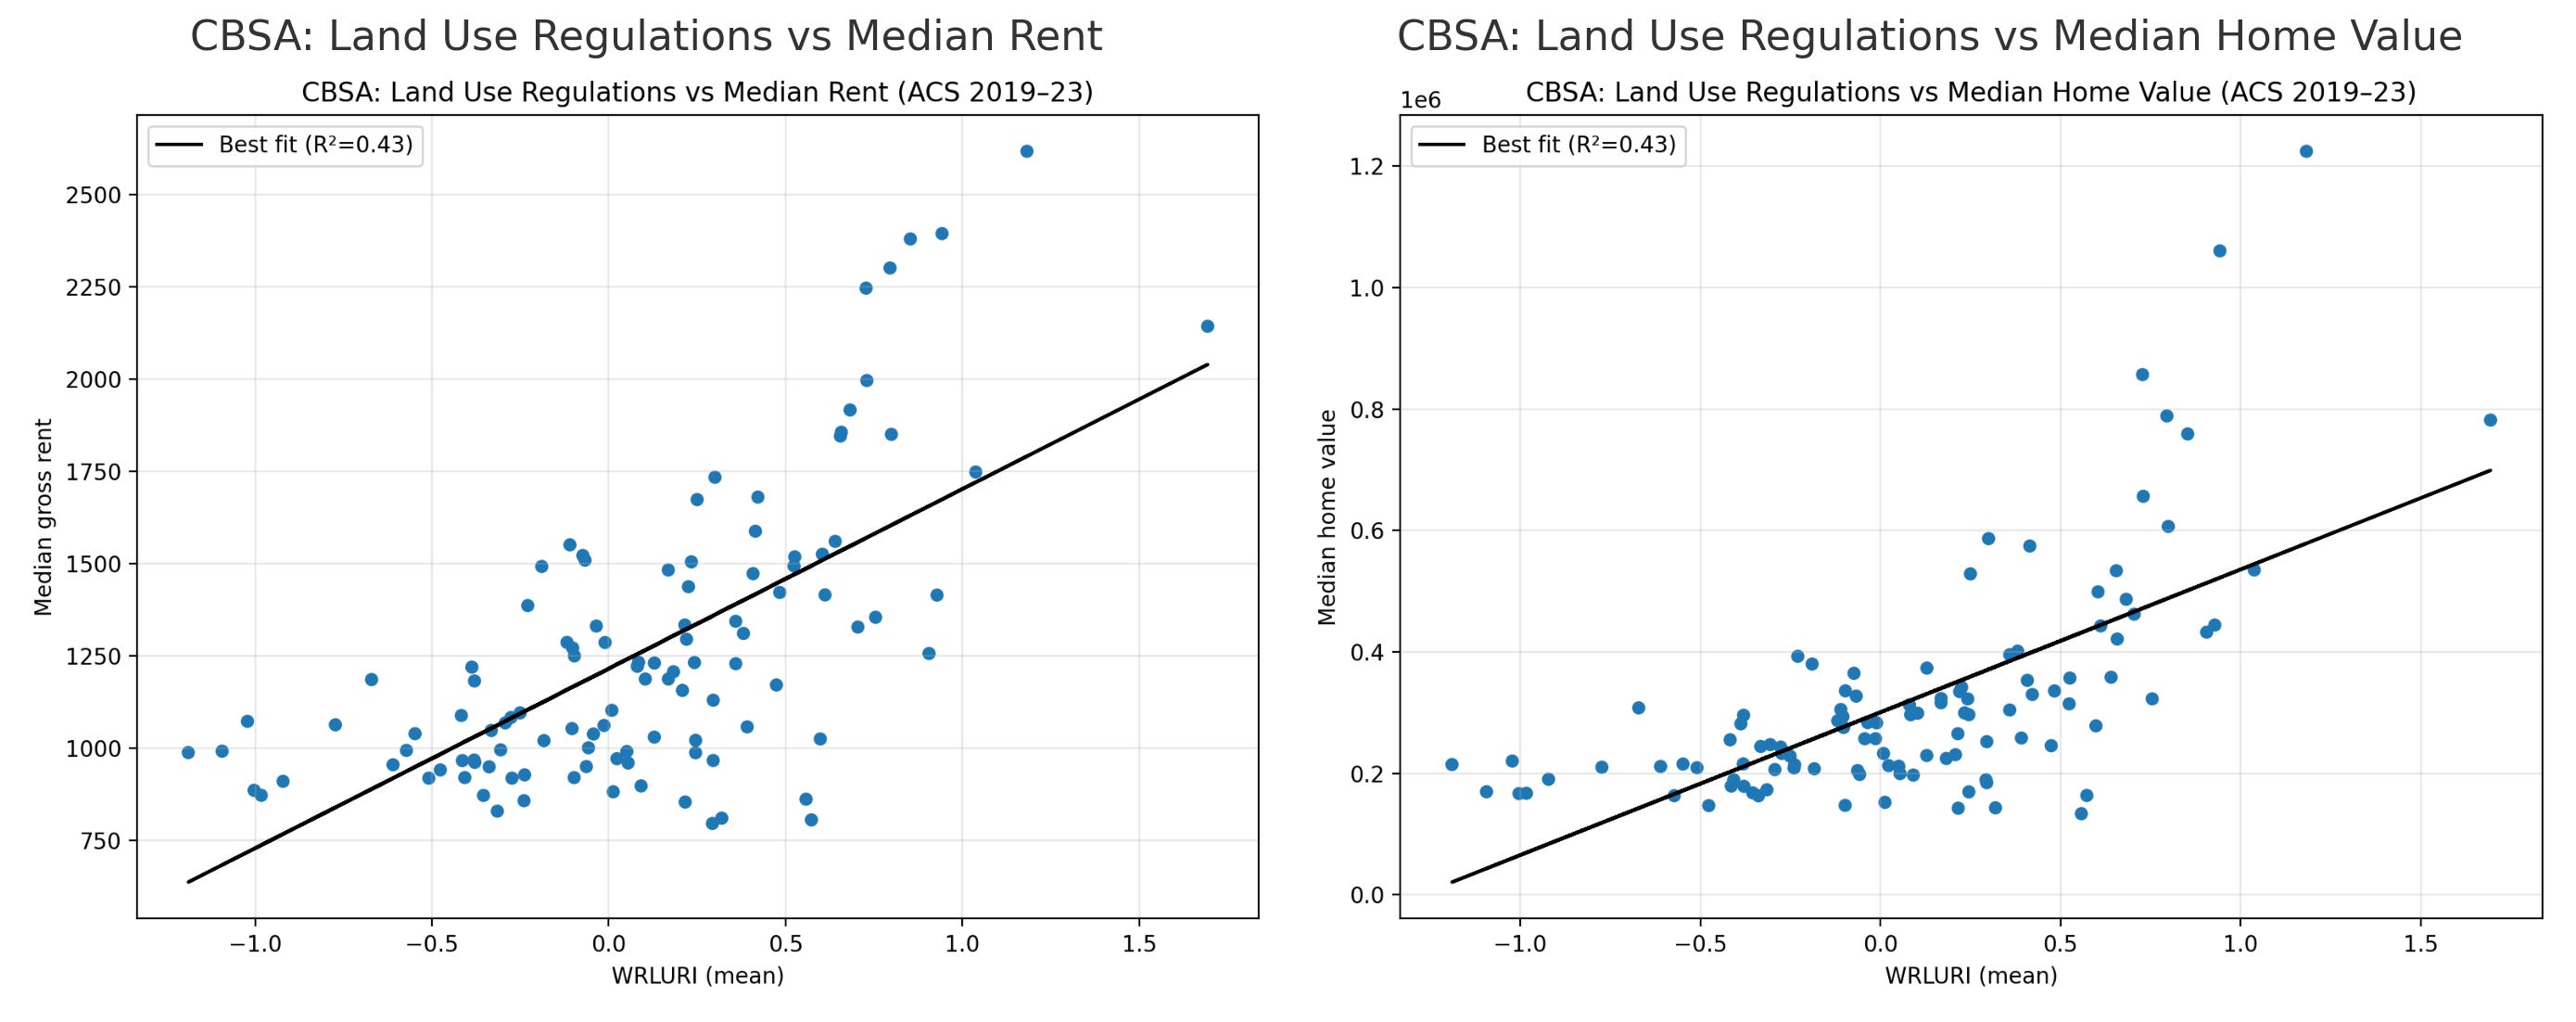
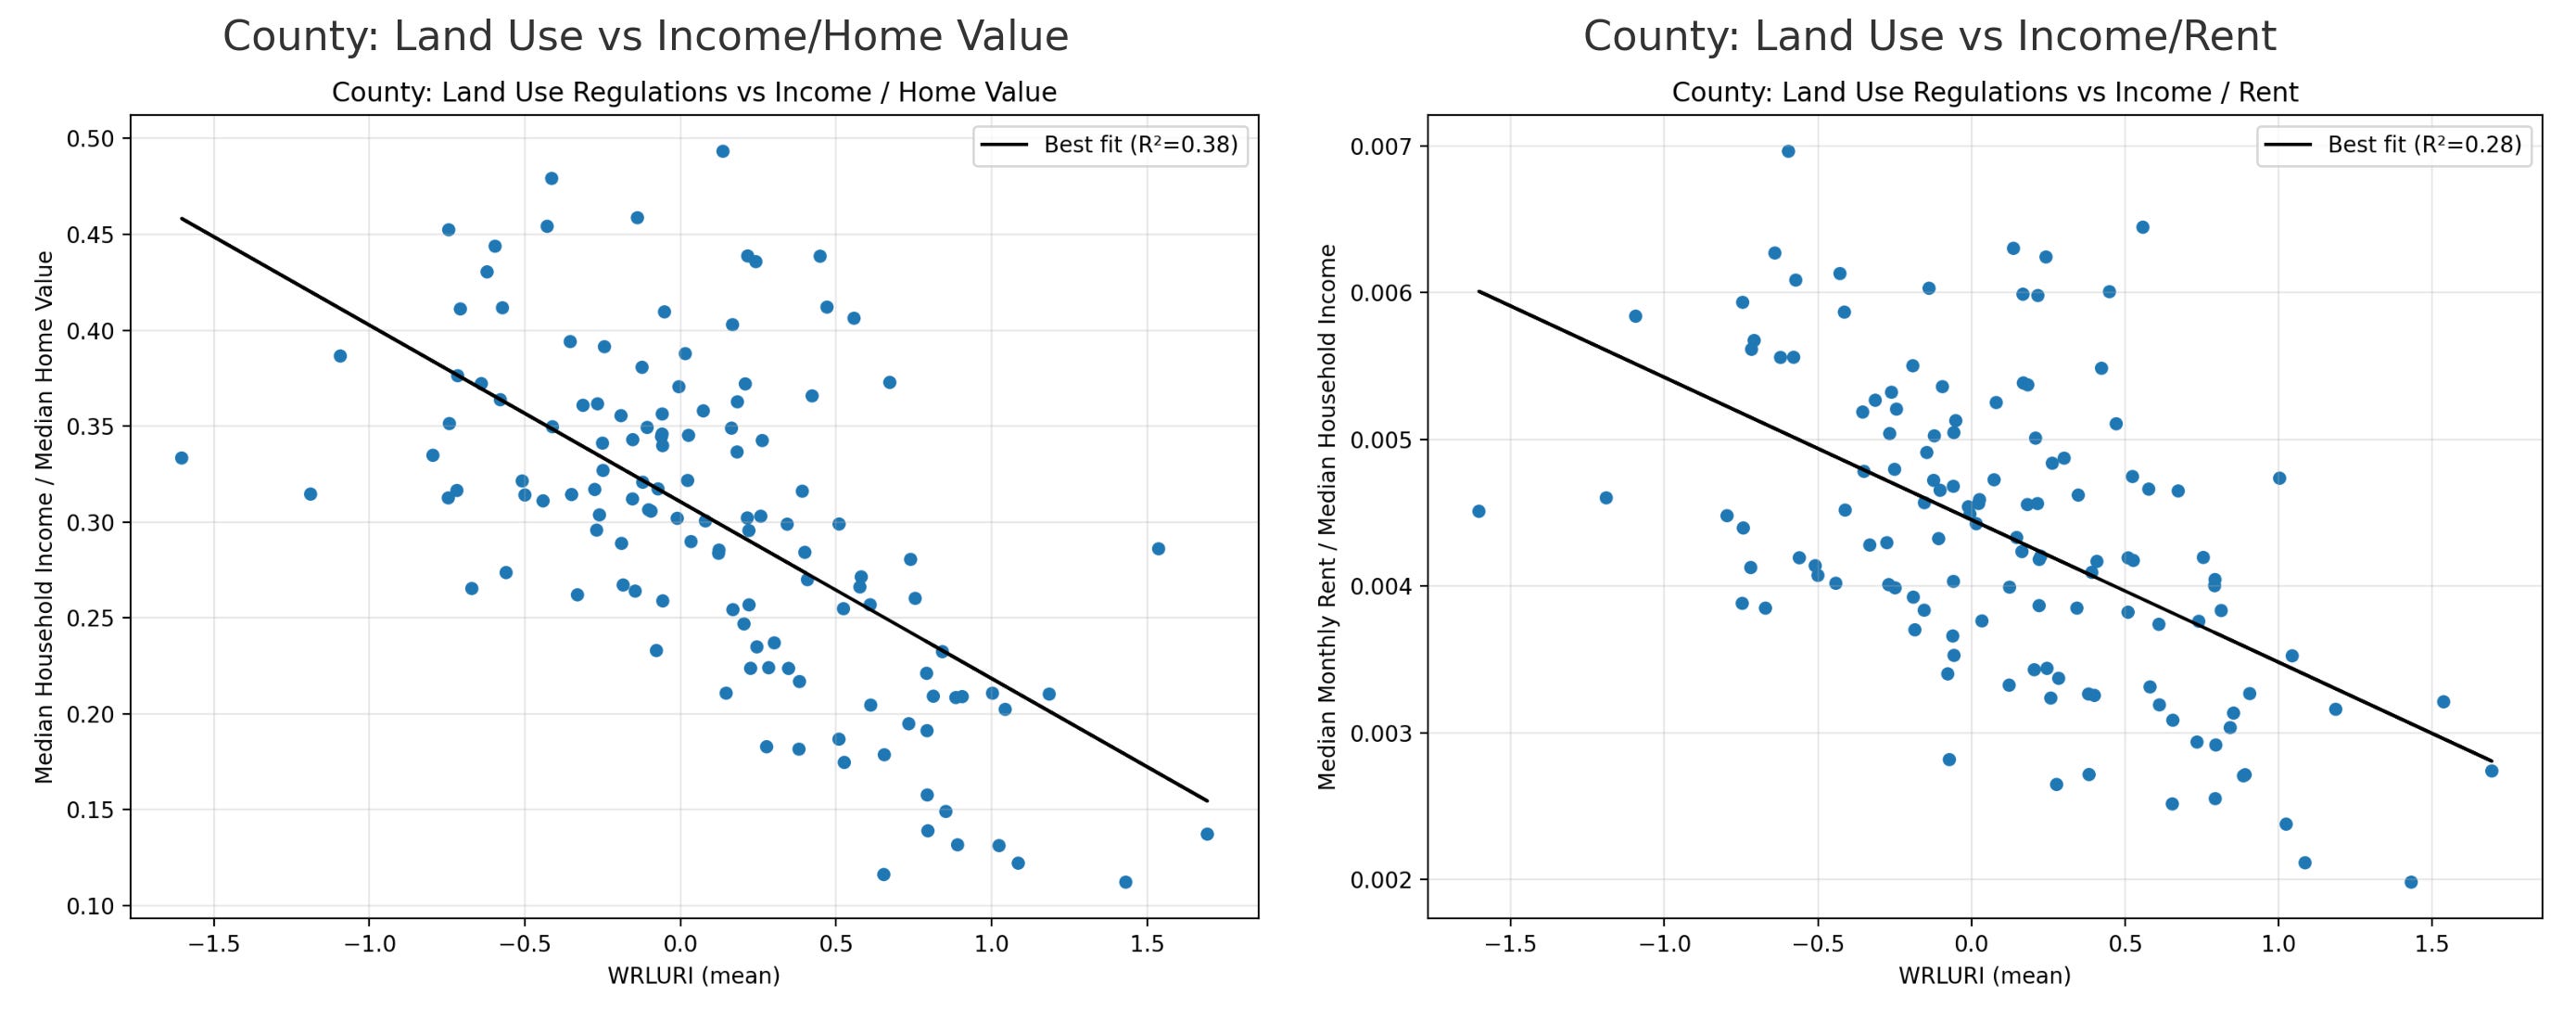
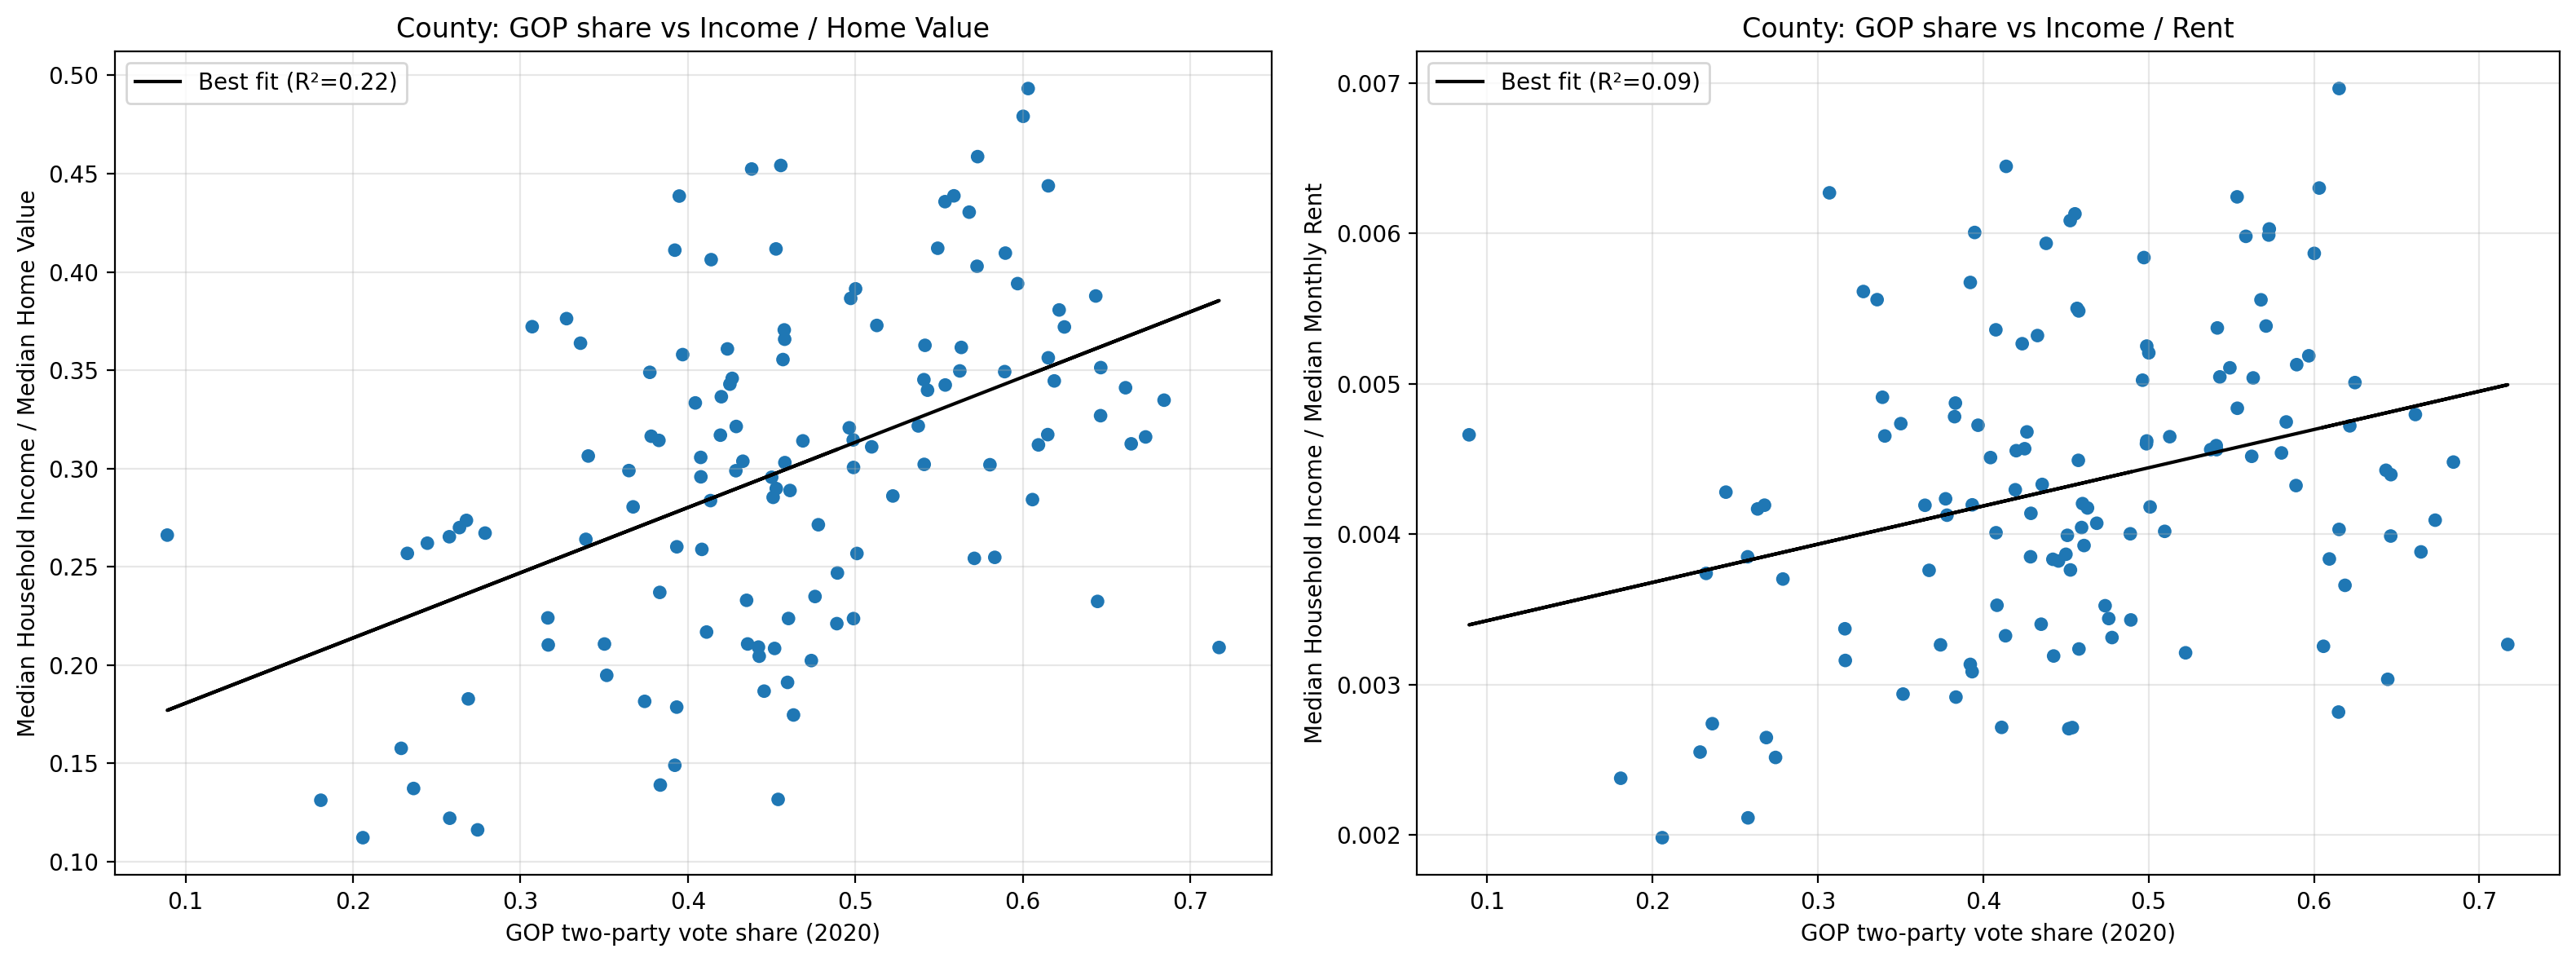
In the name of parsimony I will only present the relative costs at the county level.
At the state level the relationship between GOP vote share and land use regulations is negative. This means states which are more Republican have less strict land use laws.
At the county level the dynamic becomes less strong but still exists and continues to be negative.
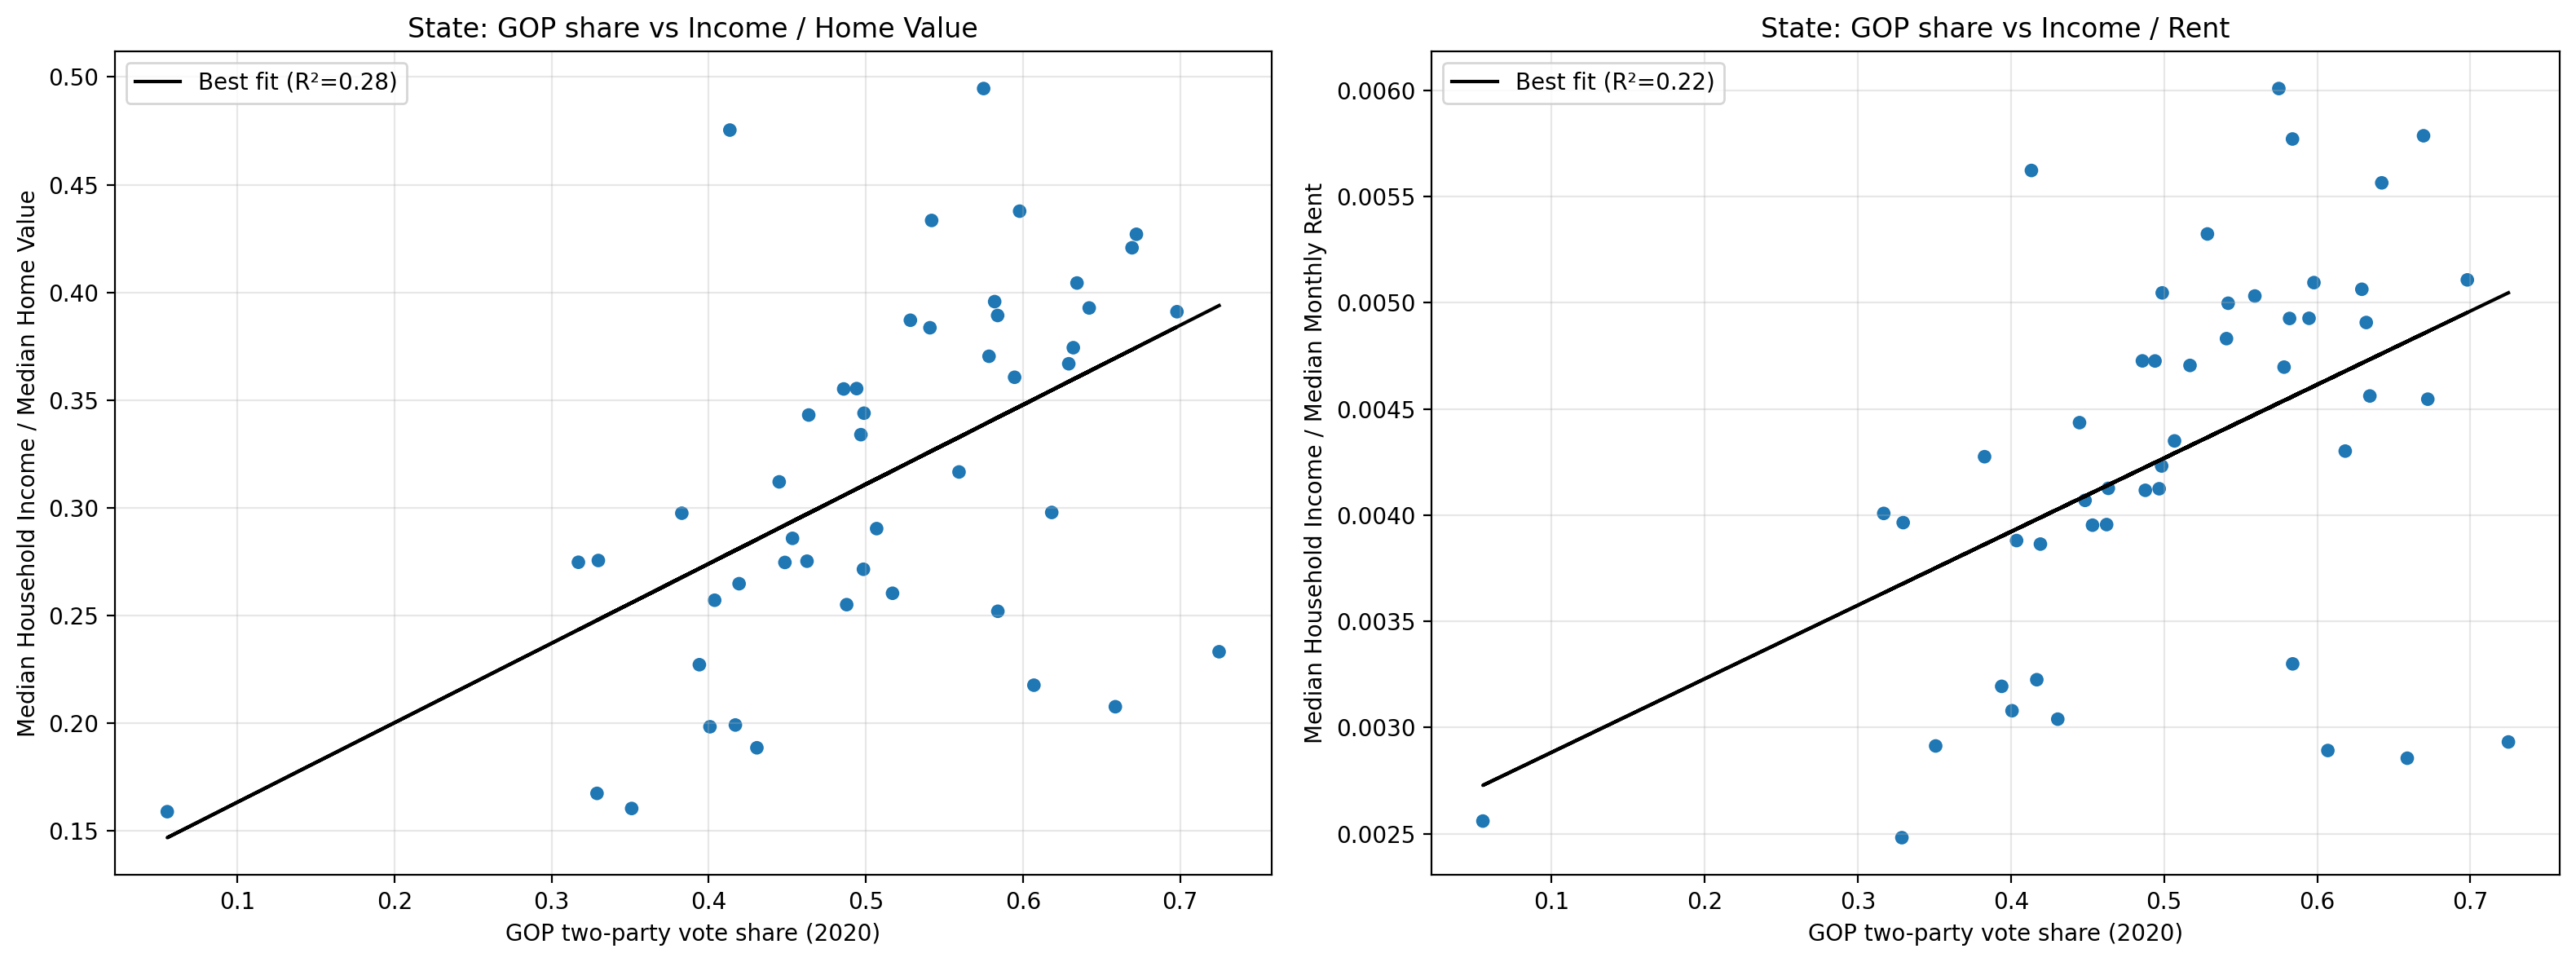
As a result of this dynamic GOP counties and states are relatively more affordable in terms of income. Although notably the relationship is much less strong when costs are measured in terms of rental costs.
Conclusion:
Taken together, the evidence paints a fairly consistent picture. Stricter land use laws are strongly and measurably linked to higher housing costs.
The partisan dimension is also clear. Republican-leaning states and counties tend to have fewer restrictions and, as a result, more affordable housing markets. Democratic-leaning jurisdictions, by contrast, are more regulated and more expensive, on average.
Let us know if anything here surprised you or if there is an angle you feel like we have missed!
Among cities with 5 or more responses.
I feel like there might be lurking variables such as population density.
Interesting breakdown. Makes me wonder how much of this is regulation itself vs. density, demand, and geography doing the heavy lifting