

Where are Apartment Rents "Collapsing"?
What the ApartmentList.com data shows


A quick preface: the housing crisis discourse is full of conflations, many of them false. National-level averages collapse wildly different markets into a single number. They erase cross-sectional heterogeneity — Austin’s permissive supply elasticity looks nothing like San Francisco’s land-constrained infill; Phoenix’s investor-heavy turnover isn’t New York’s rent-control equilibrium. They also muddle categories: rents vs. sale prices, new vs. existing stock, nominal vs. real changes, and medians vs. the distribution’s tails. Policy regimes, migration flows, and construction permitting varies city to city, even block to block — and time horizons matter!
This is all to say that narratives must be interrogated. And today we’re interrogating this one:

Setting aside the price of homes, let’s look at rent prices (specifically multifamily apartments). The cost to rent an apartment is just as — if not more — important as the cost to buy a house. For one, renting enables relatively poor Youngs to live in desirable metros where lucrative income opportunities exist. It’s a means of social mobility in this sense — if renting were cheap everywhere, it would allow for the more optimal spacial allocation of human capital resources. But since it isn’t, high human capital who lack the financial means to move up the income ladder — via geographical relocation — are stuck in markets where they underperform relative to their potential.
Secondly, to the extent rent prices fall even while the cost to buy a house does not, it could actually free up more existing supply of homes for purchase as would-be sellers’ opportunity costs of selling diminish (i.e., own-to-rent transition becomes less costly). This could importantly help alleviate the mortgage rate lock-in effect as well. So, lower rental prices have the potential to also reduce frictions in the — to a large, nontrivial extent, gridlocked — market for homeownership.
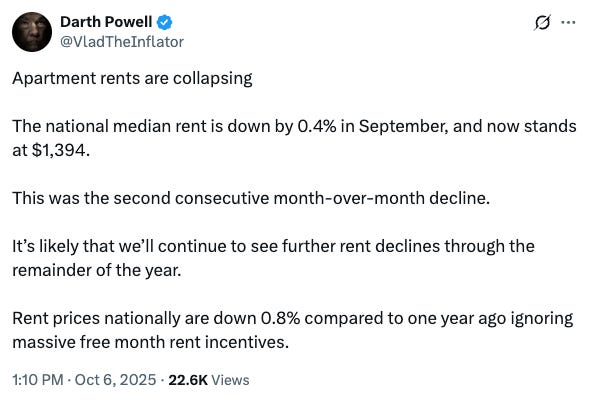
Let’s first look at which markets are experiencing the most pronounced drops in rents since 2022:

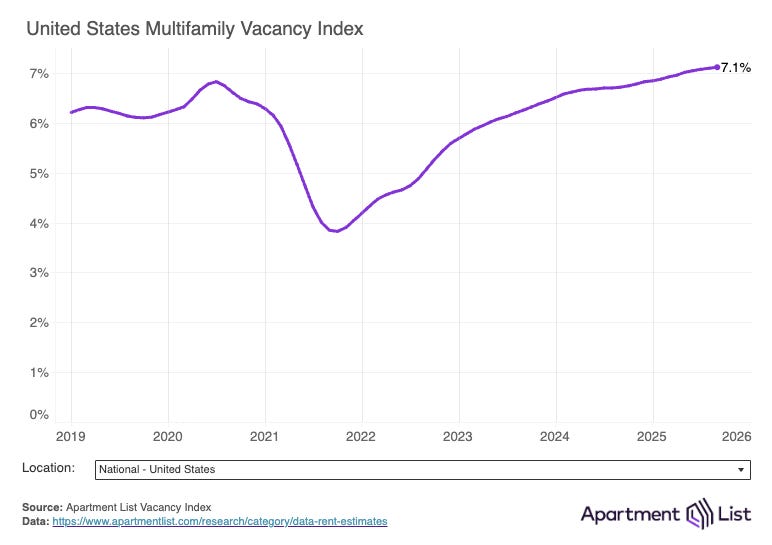
In several of these cities, vacancy rates have climbed above 10%, prompting landlords to slash rents in order to fill empty apartments. According to the Apartment List Research Team,
“[M]ore vacant units are sitting on the market, meaning that property owners face more competition for renters and have less pricing leverage. Our national vacancy index – which measures the average vacancy rate of stabilized properties in our marketplace – currently sits at 7.1 percent. This represents an all-time high for this data series, going back to the start of 2017.”
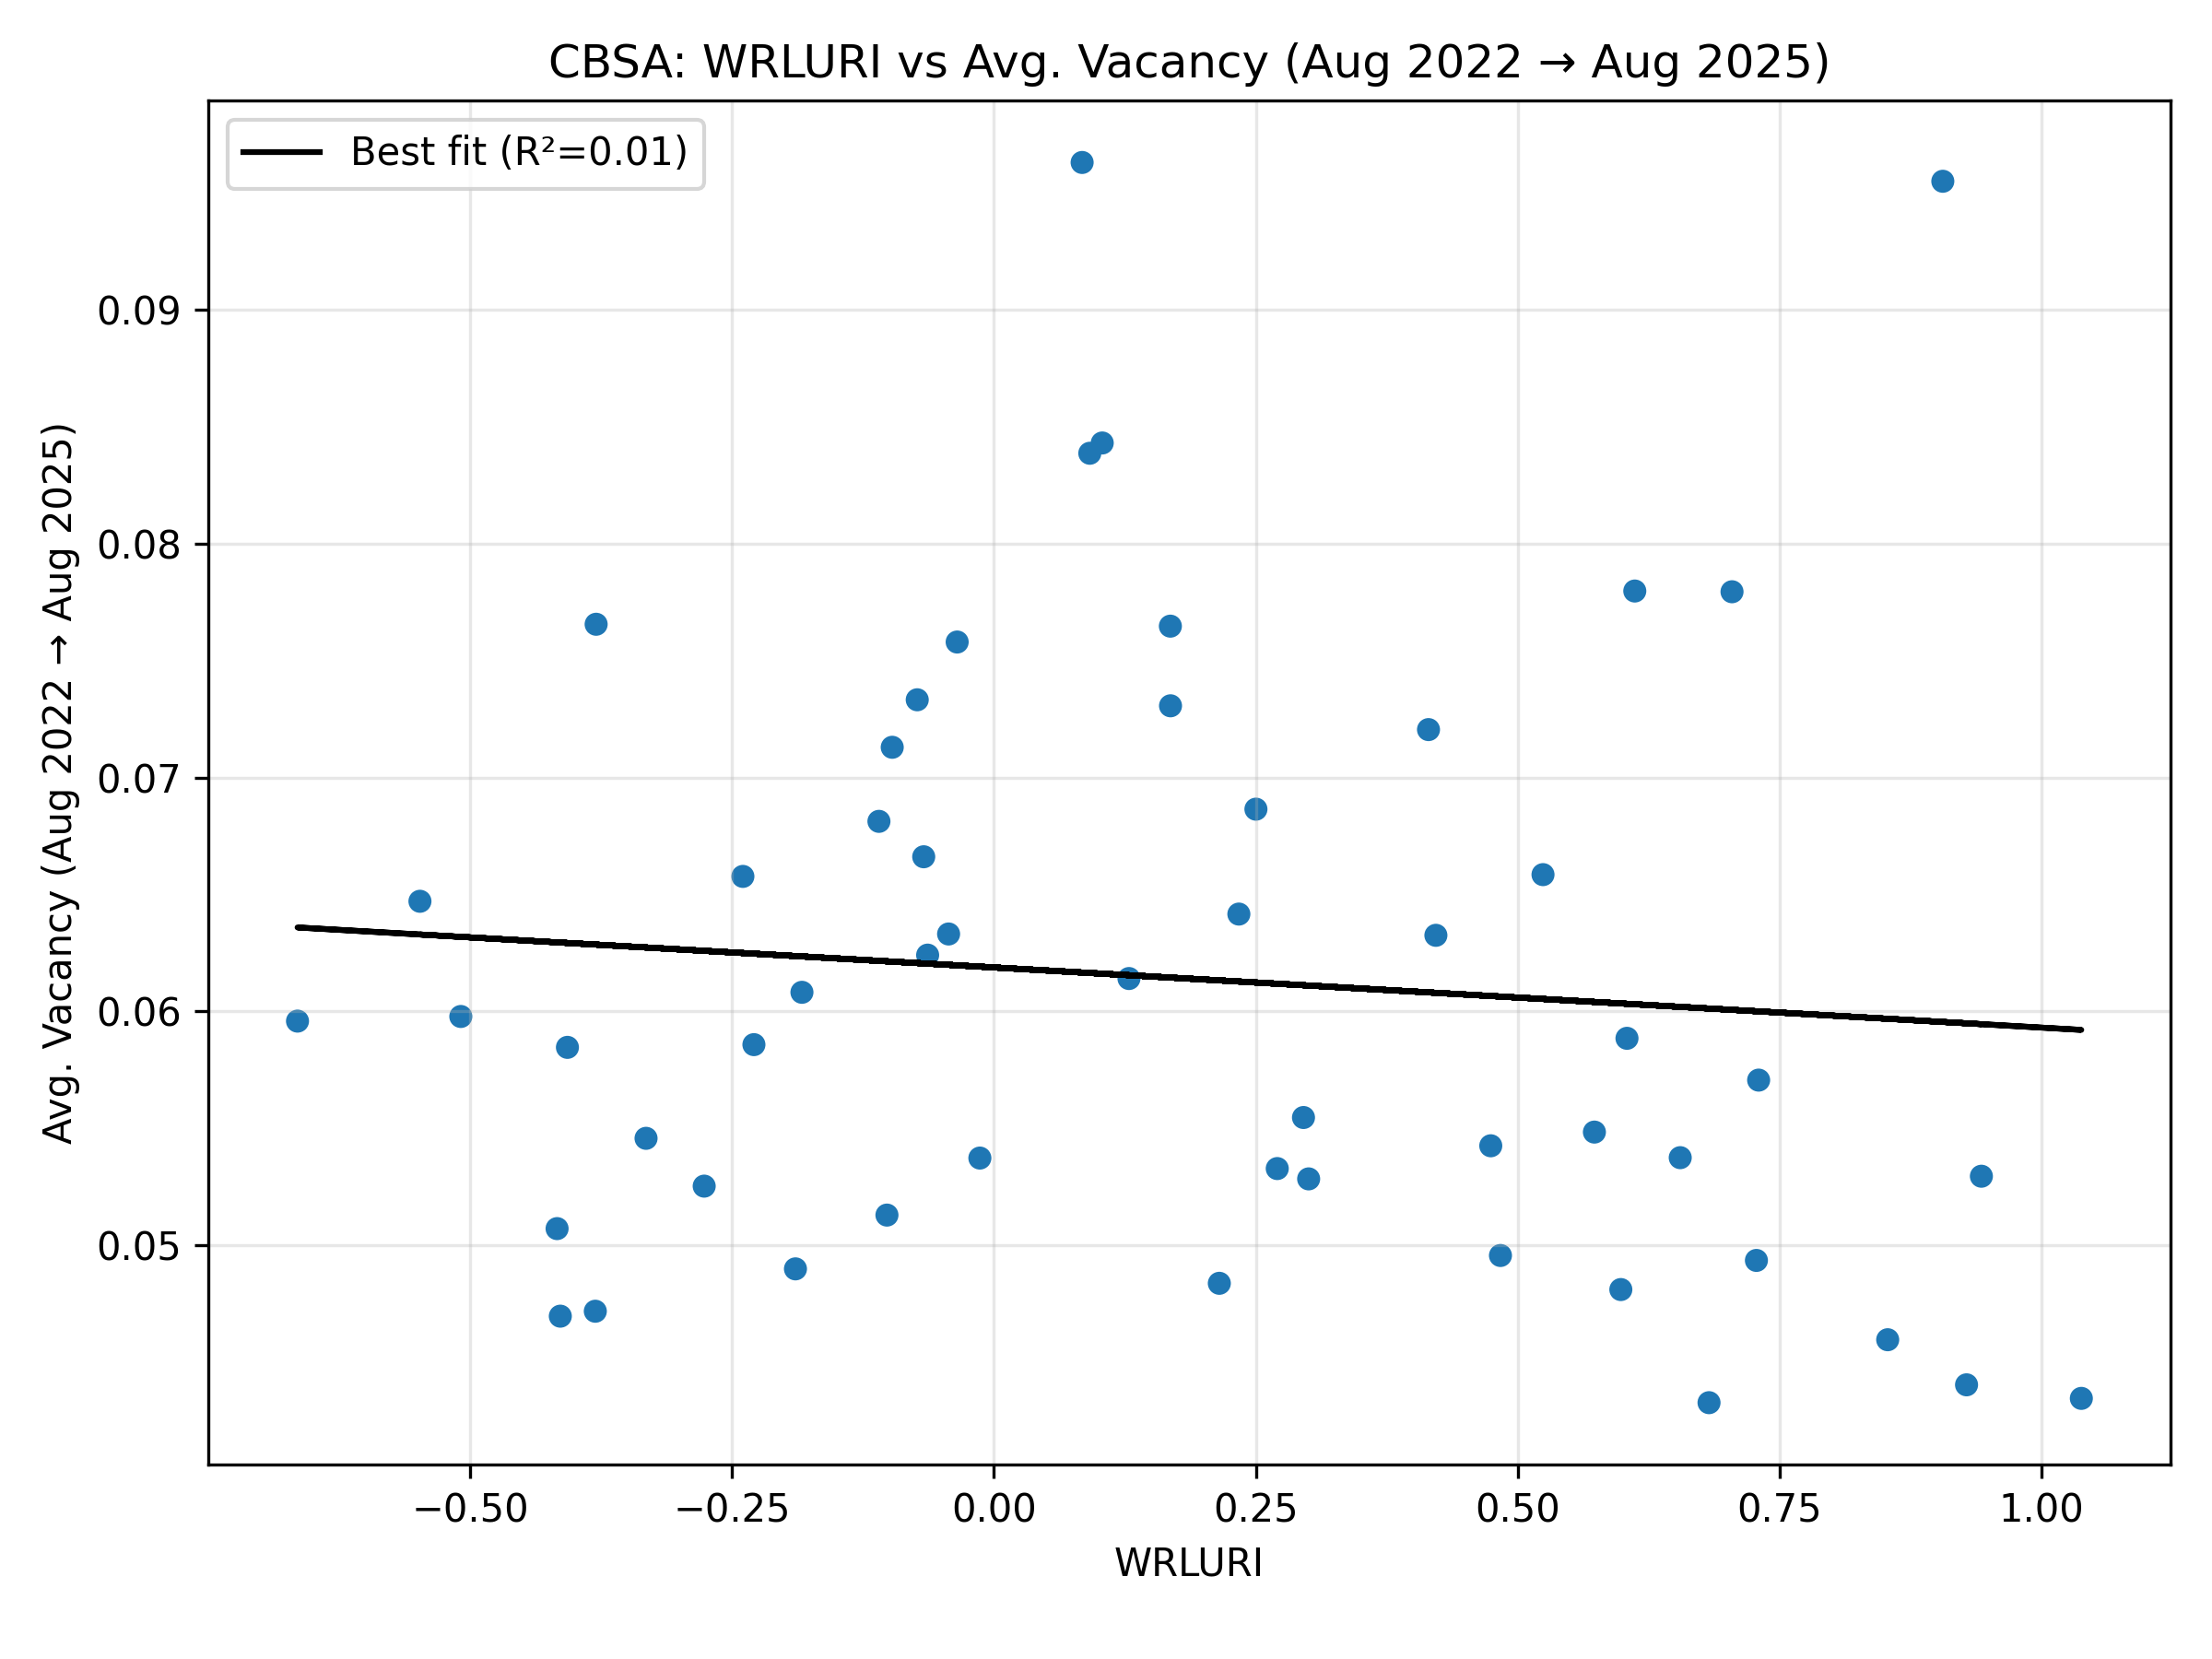
Indeed, there’s a clear relationship — at the MSA level — between rising vacancies over the past three years (x-axis) and falling rents (y-axis): the more unoccupied units a market has, the greater the pressure on landlords to lower prices.

So, how do we get there? What is the surefire way to achieve higher vacancies (to the chagrin of landlords, sorry!), thus lowering rents?
For our analysis, we pulled Apartment List’s dataset1 in hopes of ascertaining whether markets where apartment rents are falling happen to be the ones experiencing a surge in post-pandemic construction that has brought a flood of new units online. To assess this relationship, we look at Aug. 2025 vacancy rates compared to cumulative construction permits over the course of Sept. 2022 - Aug. 2025 across major MSAs:
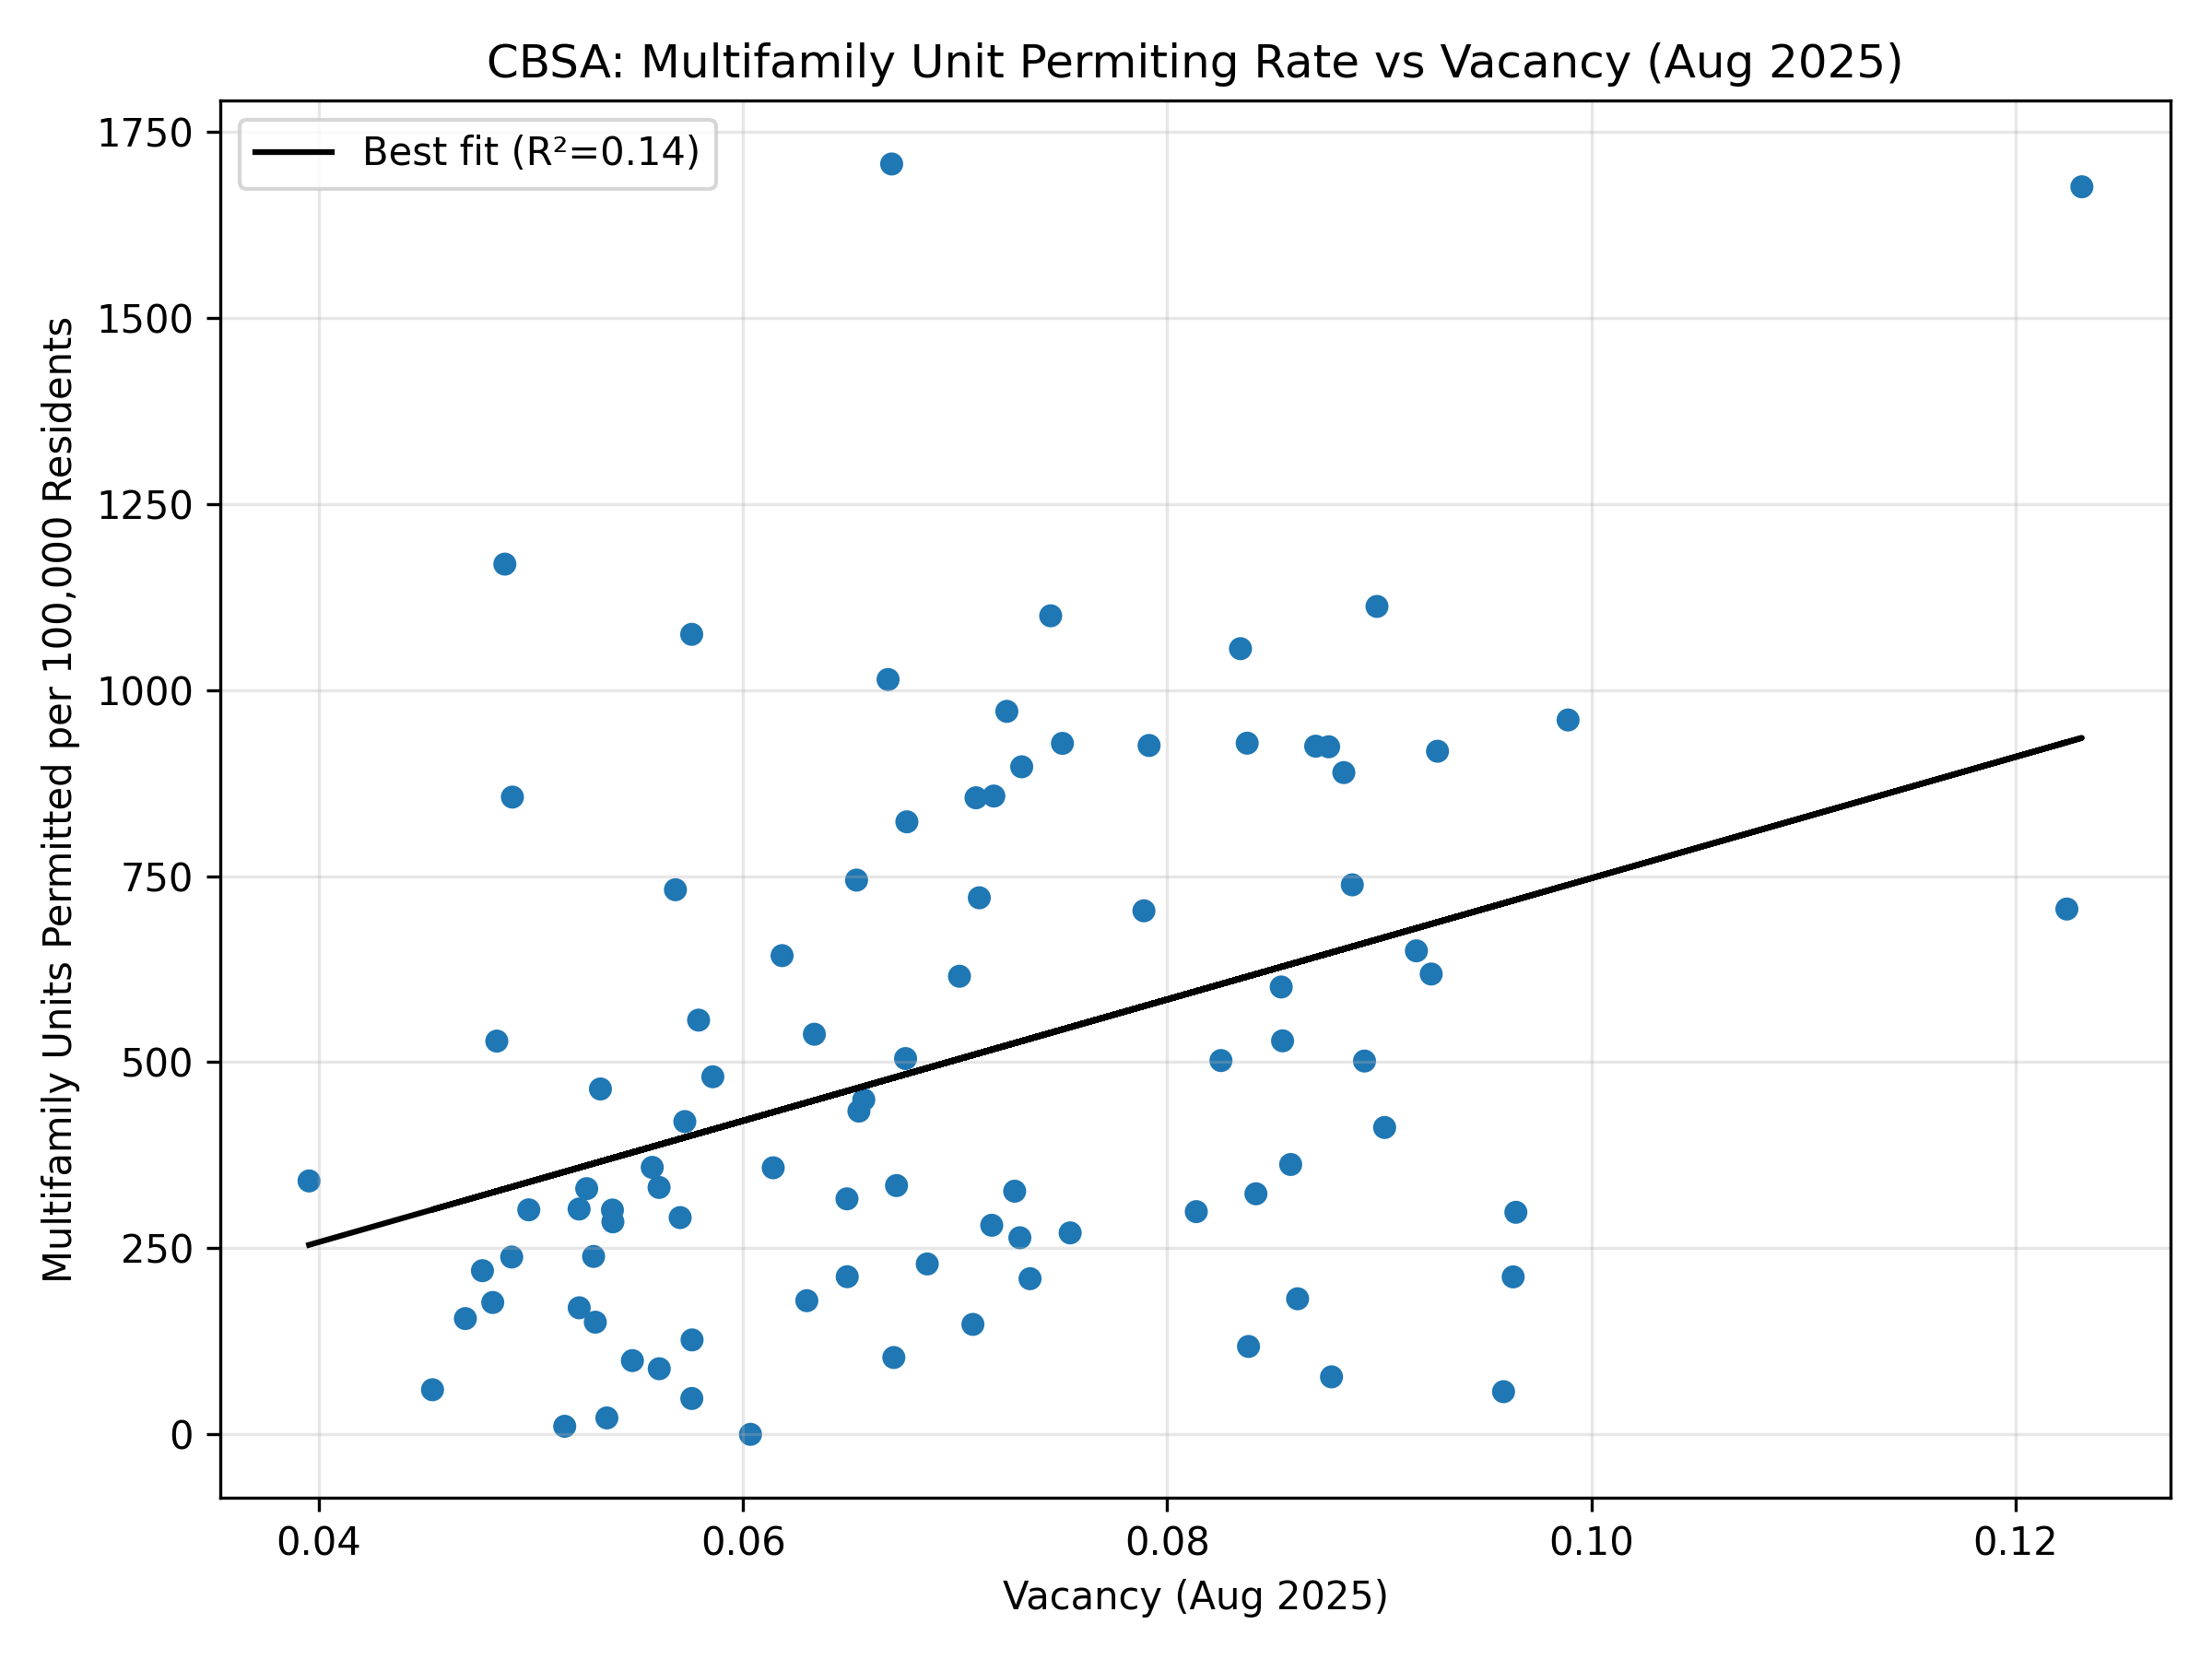
At a cursory level, we can see that there exists some relationship between new multifamily construction and apartment vacancies. It makes sense: all else equal, as new apartment supply comes online (accumulates), vacancy rates ostensibly should tend higher.2
From an econometrics perspective, our analysis is far from robust — or even conclusive. But it passes the smell test. If we assume a fair deal of apartment rent growth (decline) is explained by vacancy levels, and that vacancies are (in part) downstream of construction permits, we can superficially conclude that higher construction leads to lower rent.
This relationship is even more clearly on display in an analysis run by Apartment List senior housing economist Chris Salviati, as of May 2024. He notes:
“This influx of new inventory coincides with a rapid cooldown in the pace of rent growth, clearly demonstrating the economic relationship between supply and prices … The impact of new supply on rent growth becomes even more clear when we plot metro-level data, which shows that the markets that have been building most rapidly are also seeing the sharpest dips in rent prices.”
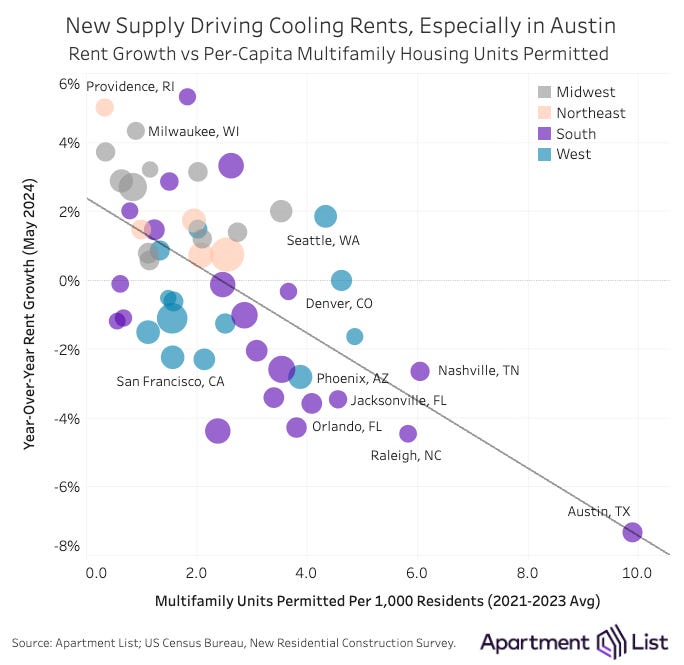
(Note that this measures multifamily units permitted on a lagged, averaged basis — different from how we measured it. Perhaps we’d yield a clearer relationship in our analysis by adopting these conventions. We’ll continue tinkering with our data as we move forward.)
The article goes on to provide more granular color:
“Austin, TX presents the clearest example of this trend. From 2021 to 2023, an average of 9.9 multifamily units were permitted for every 1,000 existing residents in the Austin metro, by far the highest rate among the nation’s 50 largest metros. As these new units have gradually reached completion, the median rent in the Austin metro has fallen by 7.3 percent over the past year, which also ranks first among the top 50 metros. Beyond Austin, a similar dynamic is at play in a range of markets across the Sun Belt.”
Another angle that isn’t so obvious — or widely considered as causal as supply changes vis-a-vis vacancy rates — is the impact of in- vs. out-migration. That is, the degree to which population flows may cause fluctuations in vacancy rates (thus rent prices). Perhaps, provided that we are able to find good data on intra-US metro population flows, this may be worth analyzing in the future as it relates to vacancy rates.
We were also curious to see how multifamily construction (permitting) rates may fluctuate along the lines of varying land use regulatory regimes across metros. (If you recall last week’s article, this can be measured using the Wharton Residential Land Use Regulatory Index [WRLURI].)
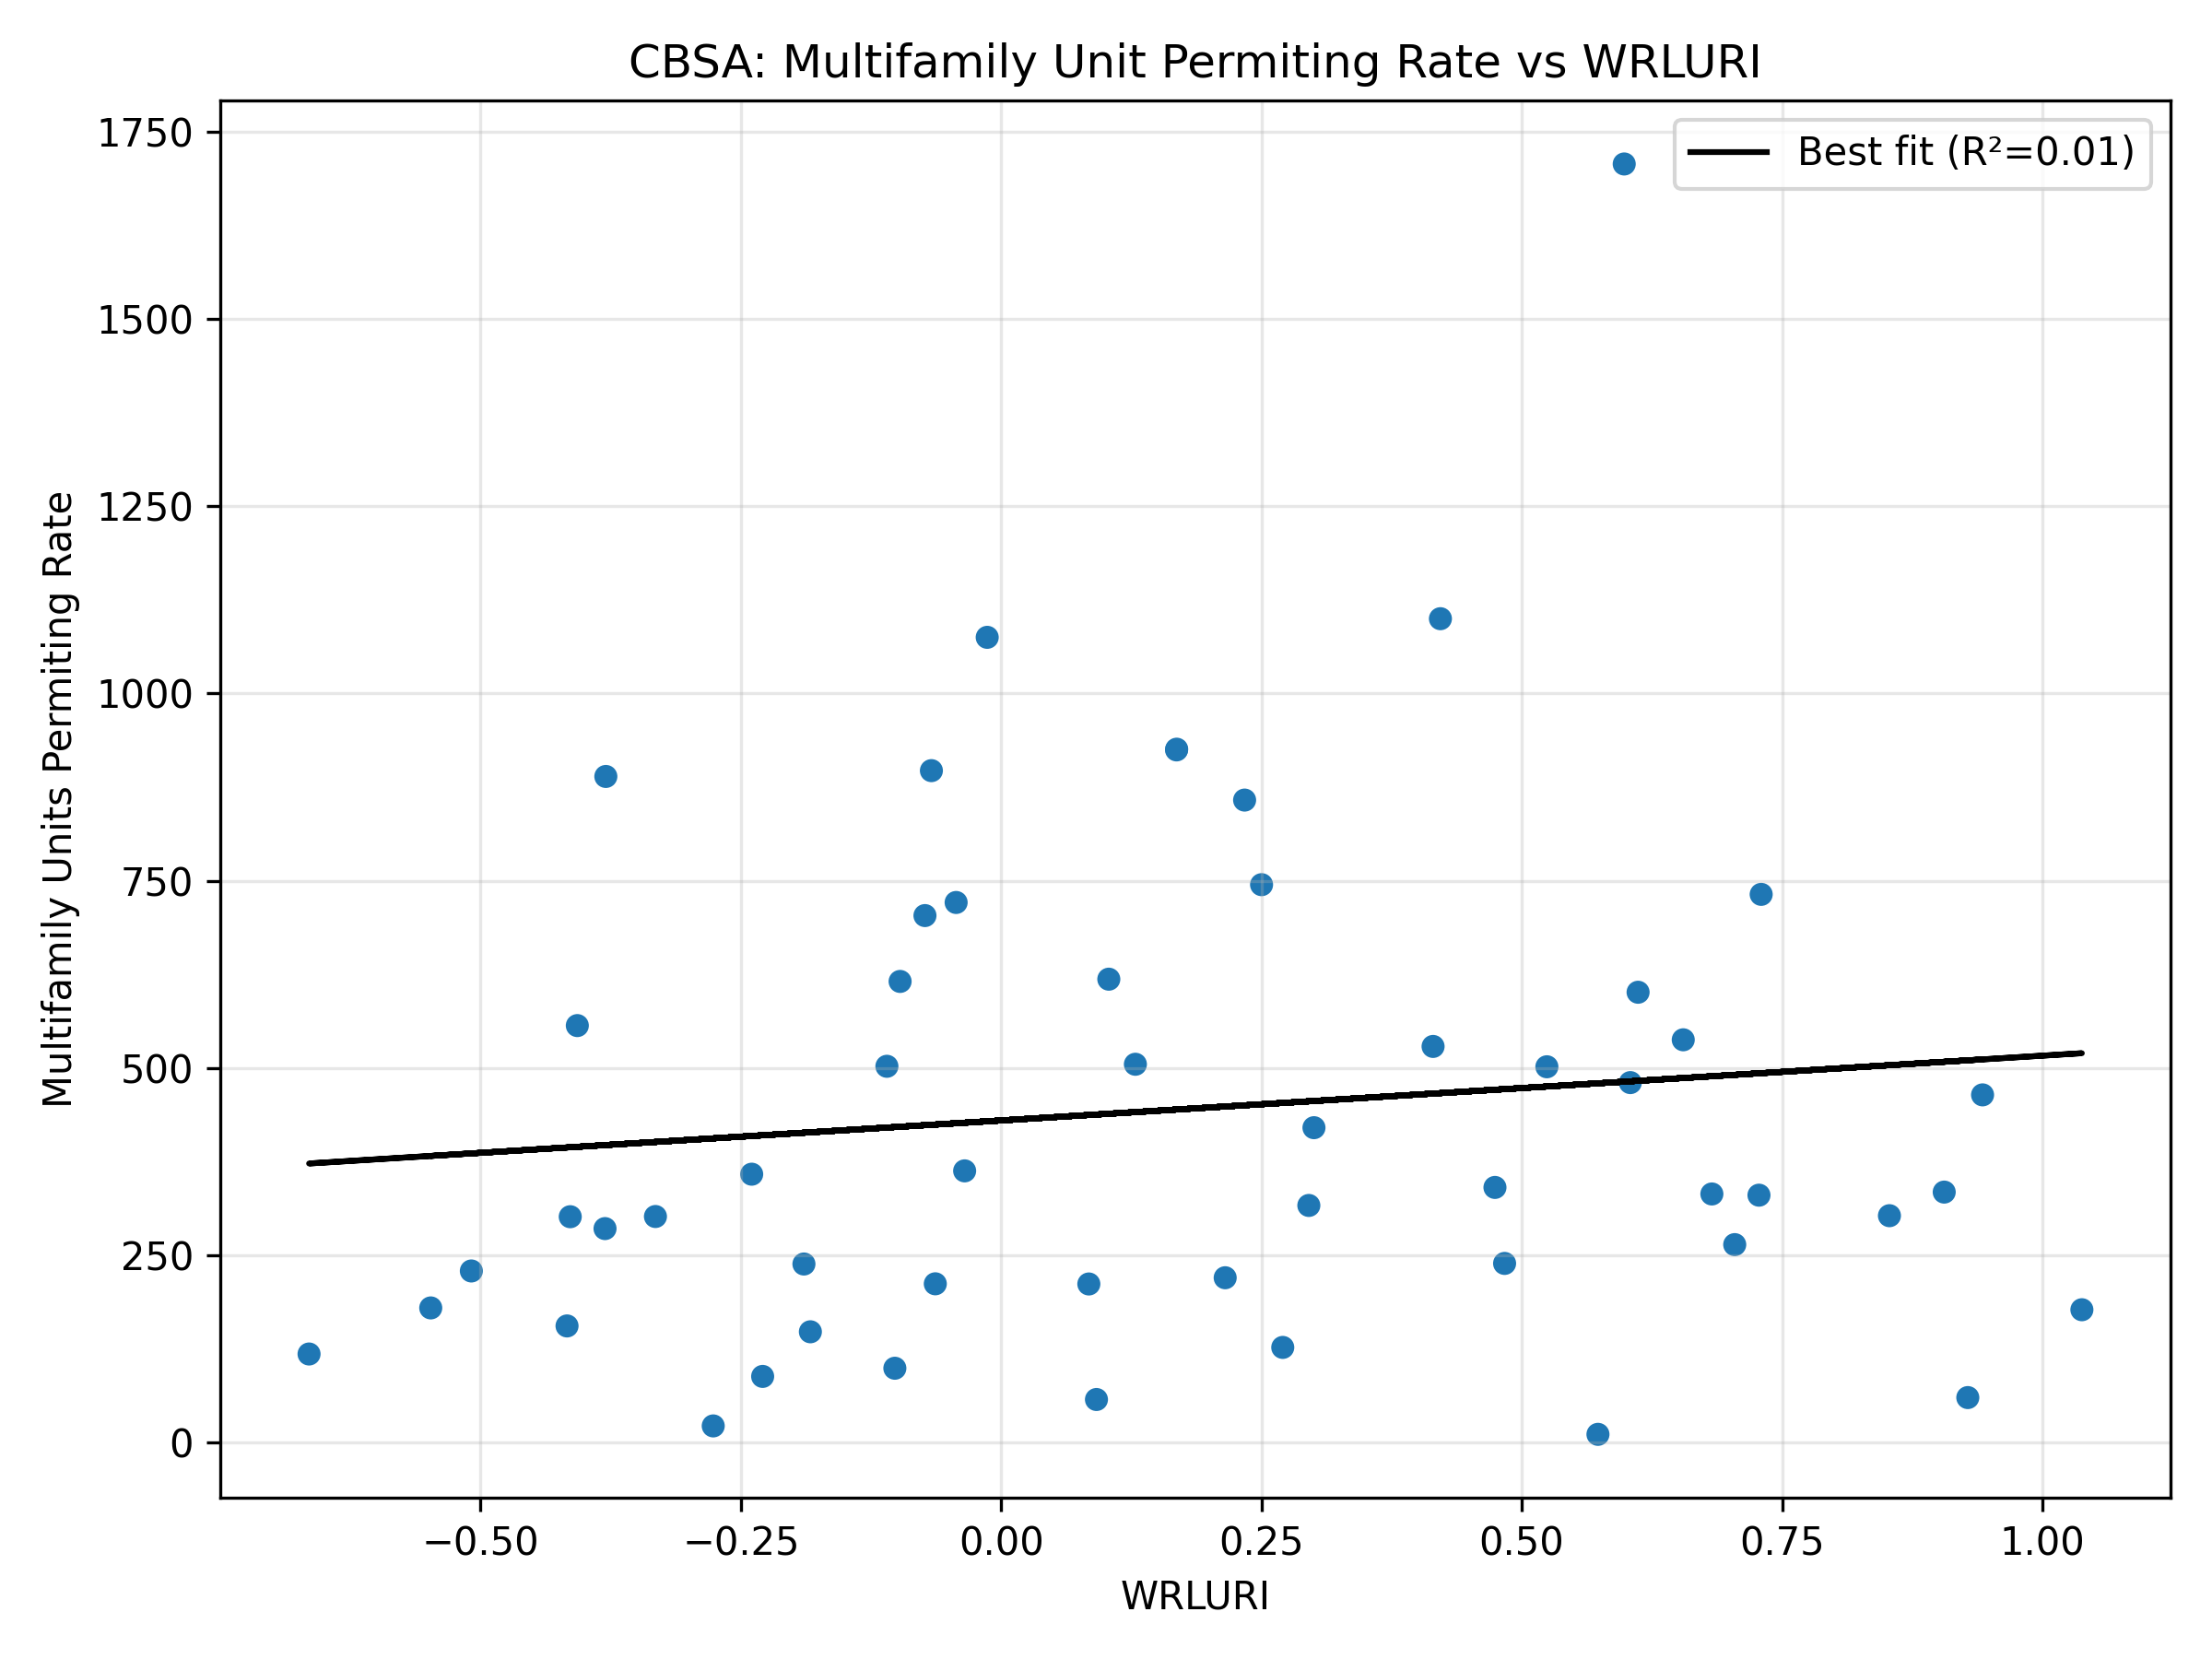
At first glance, no compelling relationship emerges.
This too may be worth further exploration, though. While the WRLURI dataset has been shown to be statistically significant as an operationalization of jurisdictional restrictiveness (Gyourko, Hartley, and Krimmel 2020) it is far from comprehensive in terms of number of metros/regions included. Additionally, while it demonstrably captures important variation in local housing regulation, supporting its statistical validity — WRLURI scores are significantly associated with higher house values, higher incomes, and higher educational attainment at the jurisdiction level — its significance doesn’t necessarily extend to the multifamily sector, specifically vacancy rates, construction permitting, and/or rent prices.
Arpit Gupta et al. have pioneered some groundbreaking methods on generative regulatory measurement, using Large Language Models to interpret of US zoning documents — “with 96% accuracy in binary classification and 0.87 correlation for continuous questions.” We hope to incorporate this work in future analyses.
Did we miss something? Have any ideas for further analysis? Let us know in the comments!👇
Additionally, if you or someone you know is interested in competing in the Boyd Essay Contest for a chance at $2,500 cash and a Boyd fellowship, the submission window is open through the end of October. Details here:
Boyd Essay Contest: Call for Submissions

We’re looking for essays that answer one simple question: What’s an actionable, outside-the-box solution to America’s housing crisis?
Note that not all MSAs are included in Apartment List’s dataset. Their Vacancy Index methodology explainer can be found here.
Obvious as this may seem, there are still plenty who believe that increased housing supply leads to increased prices. These folks are likely Mamdani Pilled (respectfully, of course).
Here’s a big thing you missed, 4 of the top 10 cities you mentioned were absolutely devastated by hurricanes during the years mentioned. Fort Meyers, Naples, North Port, and Asheville are the ones I know of the top of my head, but I wouldn’t be surprised if something similar happened at the others. I have a family member that sold his house to someone local who was renting to leave and never come back. If enough people did that, it could decrease rent sizably. I think natural disasters are outliers that are hard to generalize from.
Some really interesting data and graphics! Thanks for your work