Weekly Roundup #2
Housing | Week of 9.22 - 9.27
Welcome back to the Boyd Roundup! Will here.
This week was another research- and data-heavy one. While Peter Banks continued his fine work on census tract-level housing statistics — and posted about it here — I took a stab at some of the academic research and policy literature surrounding the ongoing housing crisis. There was also a fair bit of newsflow this week in the housing space.
Read on below for summaries of and links to what we discovered this week — as well as a couple key charts with accompanying commentary. But first, vote on this week’s poll!
Additionally, if you or someone you know is interested in competing in the Boyd Essay Contest for a chance at $2,500 cash and a Boyd fellowship, the submission window is open through the end of October. Details here:
Boyd Essay Contest: Call for Submissions
We’re looking for essays that answer one simple question: What’s an actionable, outside-the-box solution to America’s housing crisis?
Community Poll
Last week’s poll asked readers the following: What is the root cause of the US housing affordability crisis?
The top answer was Zoning and regulatory hurdles (33%), followed by Monetary policy (30%), Immigration and crime (30%), Demographic and population shifts (4%), and Other (4%).
This week’s poll aims at a bit more specificity1:
News
→ Mortgage refinance demand spikes nearly 60%, as interest rates drop sharply — CNBC
Applications to refinance a home loan jumped 58% last week compared with the previous week and were 70% higher than the same week one year ago, according to the Mortgage Bankers Association’s seasonally adjusted index. The refinance share of mortgage activity increased to 59.8% of total applications from 48.8% the previous week.
[…]
“Homeowners with larger loans jumped first, as the average loan size on refinances reached its highest level in the 35-year history of our survey,” said Mike Fratantoni, senior vice president and chief economist at the MBA.
[…]
Potential homebuyers were not quite as invigorated by the drop in rates. Applications for a mortgage to purchase a home rose 3% for the week and were 20% higher than the same week one year ago.
***
→ Mortgage Applications Increased in Latest MBA Weekly Survey — Mortgage Bankers Association
“Even as 30-year fixed rates reached their lowest level in almost a year, more borrowers, and particularly more refinance borrowers, opted for adjustable-rate loans, with the ARM share reaching its highest level since 2008. Notably, ARMs typically have initial fixed terms of five, seven, or ten years, so those loans do not pose the risk of early payment shock that pre-2008 ARMs did. Borrowers who do opt for an ARM are seeing rates about 75 basis points lower than for 30-year fixed rate loans.”
[…]
The adjustable-rate mortgage (ARM) share of activity increased to 12.9 percent of total applications.
***
→ PIMCO recommends Fed halt mortgage unwind to boost housing market — Reuters
Reinvesting the proceeds of principal and interest payments by mortgage borrowers behind MBS on its balance sheet could do as much, if not more, than rate cuts to lower mortgage rates, wrote Marc Seidner, chief investment officer of non-traditional strategies, and Pramol Dhawan, portfolio manager at PIMCO.
"In a cycle where interest rate policy is politically fraught and inflation remains sticky, the Fed may find that the most effective easing tool is already hiding in plain sight," they wrote.
One option suggested by Seidner and Dhawan would be to reinvest the current MBS roll-off, which averages roughly $18 billion each month. They estimate that could reduce mortgage rates by 20 to 30 basis points.
"It could deliver as much bang for the buck as a 100-bp cut to the federal funds rate, which is what has historically been needed to achieve a similar drop in mortgage rates," they wrote.
***
→ Home Builders Trim New Construction. Lennar Earnings Will Offer Insight. — Barron’s
Construction fell more than expected in August, census data released Wednesday show. Housing starts slid to roughly 1.31 million on a seasonally adjusted annualized basis, the lowest level since May. Single-family starts dropped 7% from the month prior to an 890,000 annual rate.
[…]
Investors waiting for signs of a housing market turnaround will have their eyes on earnings and commentary from Lennar, one of the nation’s largest home builders.
[…]
To make sales in a tough housing market, builders like Lennar offer buyers discounts and deals. In a September survey of builders, 39% cut prices and 65% offered some sort of incentive, the National Association of Home Builders said this week.
“Housing affordability is hurting buyer traffic for builders, and as a result builders have slowed single-family home construction,” Buddy Hughes, the National Association of Home Builders’ chairman, said in a statement.
Builders offering incentives use their margin to do so. Lennar’s gross margin on home sales has narrowed from as much as nearly 30%—a result of the pandemic’s hot housing market—to a recent 17.8%.
[…]
The housing market has been crawling in recent years as a result of higher costs. But more construction is still needed, Fed chairman Jerome Powell said on Wednesday.
“A lot of places in the country just don’t have enough—enough housing for people,” Powell said during a press conference.
***
→ Slow growth is so 1990s. New housing law affirms drive to build — LA Times
SB 79 will be sent in October to Gov. Gavin Newsom, who is expected to sign the measure, which will override local zoning — permitting construction of up to nine stories, in some cases — for builders who propose housing projects within half a mile of transit stations.
The bill by Sen. Scott Wiener (D-San Francisco) verges on extraordinary, not only because of the size of the buildings it would allow but because it takes county and city elected officials mostly out of the equation on many construction projects.
[…]
Still, a coalition of community and homeowner groups in those counties, United Neighbors, said the law will force apartments into neighborhoods of single-family homes and makes no provision for parks and other amenities that help communities thrive.
[…]
The “not in my back yard” (NIMBY) forces of 30 and 40 years ago have been joined in the debate over the state’s future by California YIMBY, a group that says “yes” to housing development. The group predicted that Californians skeptical of the new law will get on board, once they see the results, with most new buildings well under the new nine-story limit.
“We’re just as likely to see what’s called ‘moderate density’ housing — fourplexes, six-plexes, four-floor walk-up flats — that were legal in most of California until the 1980s or so, when cities banned them,” California YIMBY spokesperson Matthew Lewis said. “Many Californians already have those buildings in our neighborhoods from the 1960s and ‘70s. SB 79 means we’ll see a few more.”
Research
→ America's Housing Supply Problem: The Closing of the Suburban Frontier? — NBER, Edward L. Glaeser & Joseph Gyourko (2025)
[O]ur evidence does not suggest that housing supply growth is slowing primarily because particular neighborhoods have become “built out.” There have been other changes and shocks to American housing markets. Real construction costs increased by 25% over the past two decades. A large fraction of the employees and establishments in the homebuilding sector left the sector after the GFC. Covid impacted supply chains and the demand for larger housing units. Most recently, rising interest rates have influenced both the demand for homes and the supply of homes for listing … some of these changes are economically material, but … the genesis of our current situation began long before the global financial crisis. This change is most prominent in America’s once expanding suburbs, where the link between new building and high house prices has been declining for decades.
[…]
[T]he rise of building costs may play a significant role in driving price growth in some markets, but it is neither the exclusive or dominant factor in America’s most expensive markets (e.g., such as Los Angeles), nor in many major markets off the coasts and in the sunbelt.
[…]
There has been a significant flattening of the empirical housing supply curve in these places. Our inelastic coastal markets already experienced this by 1990, because in these places, supply conditions have long driven new construction more than demand in those places. Within metropolitan areas, we now build less in the highest demand neighborhoods, just as we have long built less in the highest demand metropolitan areas. There is dramatically less building, especially in low density, higher price census tracts. The suburban frontier seems to be closing in some of our largest, and previously fastest growing markets. The negative relationship between density and the construction of housing has also attenuated or reversed, which is also compatible with the increasing importance of supply conditions.
To us, this suggests that American housing markets increasingly follow the model put forth by Mancur Olsen (1982). In his view, insiders increasingly use regulations to protect their own rents and keep outsiders out. If existing homeowners in high price areas have become better at controlling land use regulations and stopping new construction, then we should expect to see a decreasing link between high prices and new construction, which is exactly what the data shows.
***
→ Housing and Governance in Rhode Island — The Rhode Island Survey Initiative
We asked respondents about their support for building different types of housing at three levels: statewide, in their town, and in their neighborhood. Support was strongest when the question was about Rhode Island as a whole—between 73% and 81% said they supported every type of housing we asked about at that level. But the numbers dropped sharply as housing got closer to home. For example, 42% said they would support new single-family, market-rate homes in their own neighborhood, while only 21% supported public housing and 17% supported homeless shelters nearby.
[…]
When asked who should take the lead on building, the most popular answer was for the state to partner with non-profits (66% support). A majority (54%) also back a public developer model, where the state itself builds and directly sells affordable housing. This idea, sometimes called the “Montgomery Model,” has been discussed by leaders across the political spectrum in Rhode Island. Partnerships with private developers received thinner support (41%) and were the least preferred option overall.
***
→ The State of the Nation’s Housing 2025 — Joint Center for Housing Studies of Harvard University
According to Cotality, investors bought nearly a third of single-family homes sold in the first quarter of 2025 (31 percent), much higher than the 19 percent purchased in the same quarter of 2019. Individuals struggle to compete with large investors that can buy homes with cash or more easily secure financing, close deals quickly, and purchase several properties in a single trans-action. Such investors target modestly priced homes and have been especially active in growing Sun Belt markets. In response, lawmakers across several states have proposed legislation to prioritize sales to individuals.
***
→ Housing Policy Blueprint — Texas 2036
The remedy for high housing prices is increasing the supply of available housing units of all types that are affordable for families across the income spectrum. An influx of supply has proven to be the best marketbased solution to moderate housing costs. Notably, Austin experienced a 9.5% year over year decline in rents from June 2023 to June 2024, in part due to a surge of new rental units: in 2023, nearly 20,000 new units for rent came online in the city. Completions in the first quarter of 2024 alone added nearly 8,700 units.
While Austin’s pricing swings are a nationwide outlier, so too is a 37% increase in inventory from pre-pandemic levels, providing a strong suggestion that the substantial increase in inventory is a major driver of lower rents. The evidence for supply’s effect on lowering prices is stacking up. The Minneapolis Fed released research showing that construction of market rate apartments starts a chain reaction of moves that gives renters in lower income neighborhoods access to an abundance of open units — about 70 new openings for every 100 new apartments.
[…]
The paper from which the Financial Times derived their chart found that while most people (both renters and homeowners) want housing prices in their cities to decline, “only 30-40% believe that a higher supply would lead to this outcome. This skepticism towards the 'supply and demand' principle in housing starkly contrasts with respondents’ otherwise accurate understanding of other markets. Instead, for housing, there is a strong, stable 'folk economic' belief blaming high prices on landlords and developers.”
[…]
The city of Houston provides an excellent test case for how lowering minimum lot sizes allows for the construction of homes responsive to market demands. Beginning in the 1990s, Houston lowered its minimum lot sizes — in some cases to a mere 1,400 sq feet — first in the city’s urban core and later expanding to the entire city. Allowing the subdivision of larger lots has led to the development of tens of thousands of distinctive, Houston-style townhomes — tall, skinny single-family units that are often the most affordable housing option in Houston’s most desirable neighborhoods. University of Texas at Austin researchers Jake Wegmann, Aabiya Noman Baqai, and Josh Conrad note in their article in the scholarly journal Cityscape, "Here Come the Tall Skinny Houses: Assessing Single-Family to Townhouse Redevelopment in Houston, 2007- 2020" that these townhomes are usually built on previously nonresidential parcels, within the urban core, at a median assessed value approximately 60% that of the median home on a non-subdivided lot.
The article's authors summarized the reforms succinctly by saying “there can be a robust supply response provided that market conditions are ripe and the new land use regulations allow for the construction of a product that builders want to build and homebuyers want to buy”.
***
→ 2025 International Transactions in U.S. Residential Real Estate — National Association of Realtors
[M]any foreign buyers are able to spend in the U.S., where home prices remain more affordable compared to the cost of a property in a central business district in many other countries.
[…]
Along with the increase in the number of homes purchased, the dollar volume of foreign buyer purchases increased to $56.0 billion, a 33.2% increase from the prior period.
[…]
By region of origin, Asian buyers remained the largest group of buyers, with a buyer share of 38%.
[…]
Measured by the number of homes purchased, China returned as the top country of origin among foreign buyers during April 2024 to March 2025, accounting for 15% of the homes purchased by foreign buyers (11% in the prior period).
[…]
Chinese buyers continue to have the highest average purchase price at $1.2 million, as buyers purchased in population centers in more expensive states: 36% of Chinese buyers purchased a property in California, and 9% purchased in New York.
[…]
The median purchase price among foreign buyers was $494,400, which is higher than the median price of $408,500 for existing homes sold in the U.S. from April 2024 to March 2025 and the median purchase price the prior year. The price difference reflects foreign buyers more often purchasing in more central locations and the different types of properties purchased. Nearly one-fifth (18%) of foreign buyers purchased properties worth more than $1 million from April 2024 to March 2025.
Graphs/Charts & Boyd Commentary
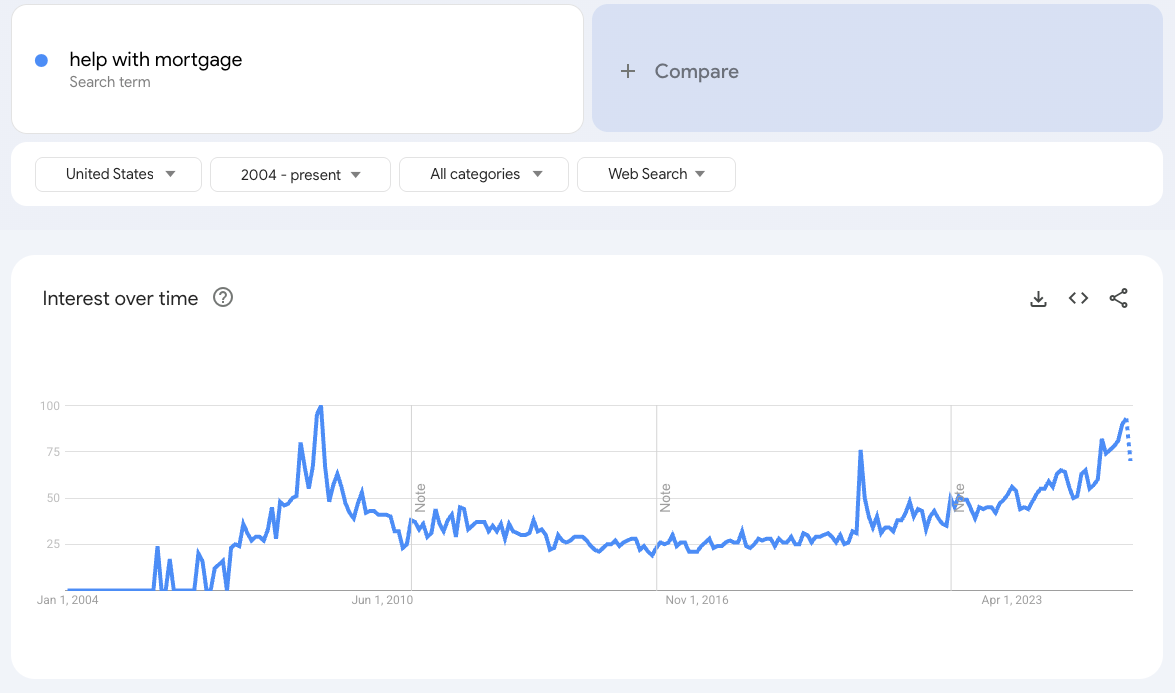
This graphic is making the rounds on X: Google searches for “help with mortgage” are near peak-GFC levels.
It is particularly shocking because we’ve already seen unprecedented interventions taking place — loan modifications, deferrals of Fannie/Freddie loans, Covid-era forbearance workouts — and yet, evidently, people still need help with their mortgages. Potential drivers are a weak labor market (household income decline) and an outsize portion of mortgages being ARMs, which become more costly as mortgage rates rise.
It could also be the case that people are, let’s say, 1-3 years into post-ZIRP fixed rate mortgages that they really never could afford in the first place — and that the rubber is now finally meeting the road. Property tax and homeowner’s insurance costs (especially in Florida and other Gulf Coast states) have also been on the rise.
***
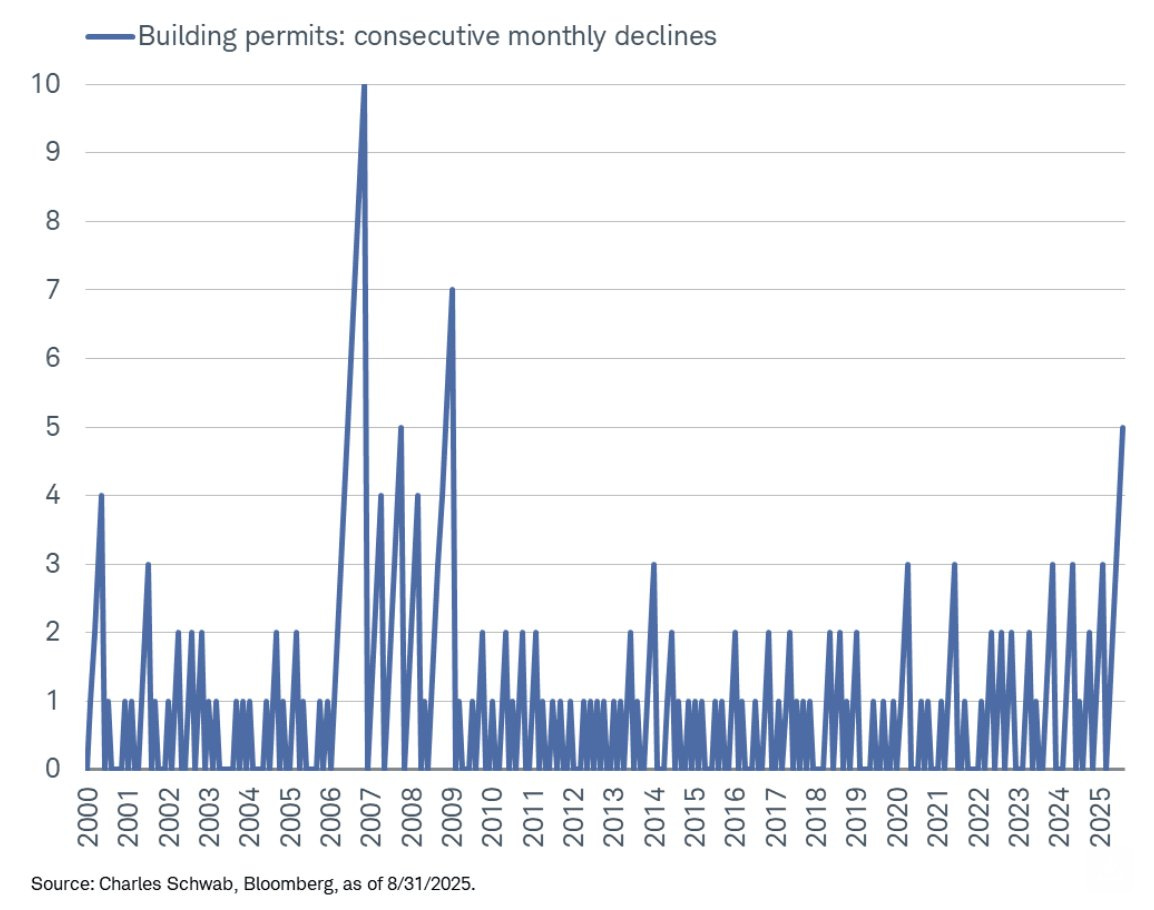
Builders are hitting the brakes as building permits have now declined for five consecutive months, the most since 2009 in the wake of the GFC.
High mortgage rates + wide MBS spreads — remember, Fed rate cuts ≠ lower mortgage rates (necessarily) — continue to weigh on buyer demand. Additionally, a record cohort of projects started in 2021–22 is delivering through 2025. Vacancies have risen and rent growth has cooled in many Sun Belt markets. Developers are pausing until absorption stabilizes and rents re-accelerate — hence fewer new permits.
After 2025’s delivery bulge, many metros (Austin, Phoenix, Nashville, Atlanta, etc.) are likely to swing from glut to equilibrium and then undersupply by 2026–27 if permitting stays weak.
Pair that with economic uncertainty around tariffs and reductions in immigration, and it becomes clear why more deals fail the go/no-go test until labor shortages and materials cost volatility abate.
Doesn’t bode well for affordability.
***
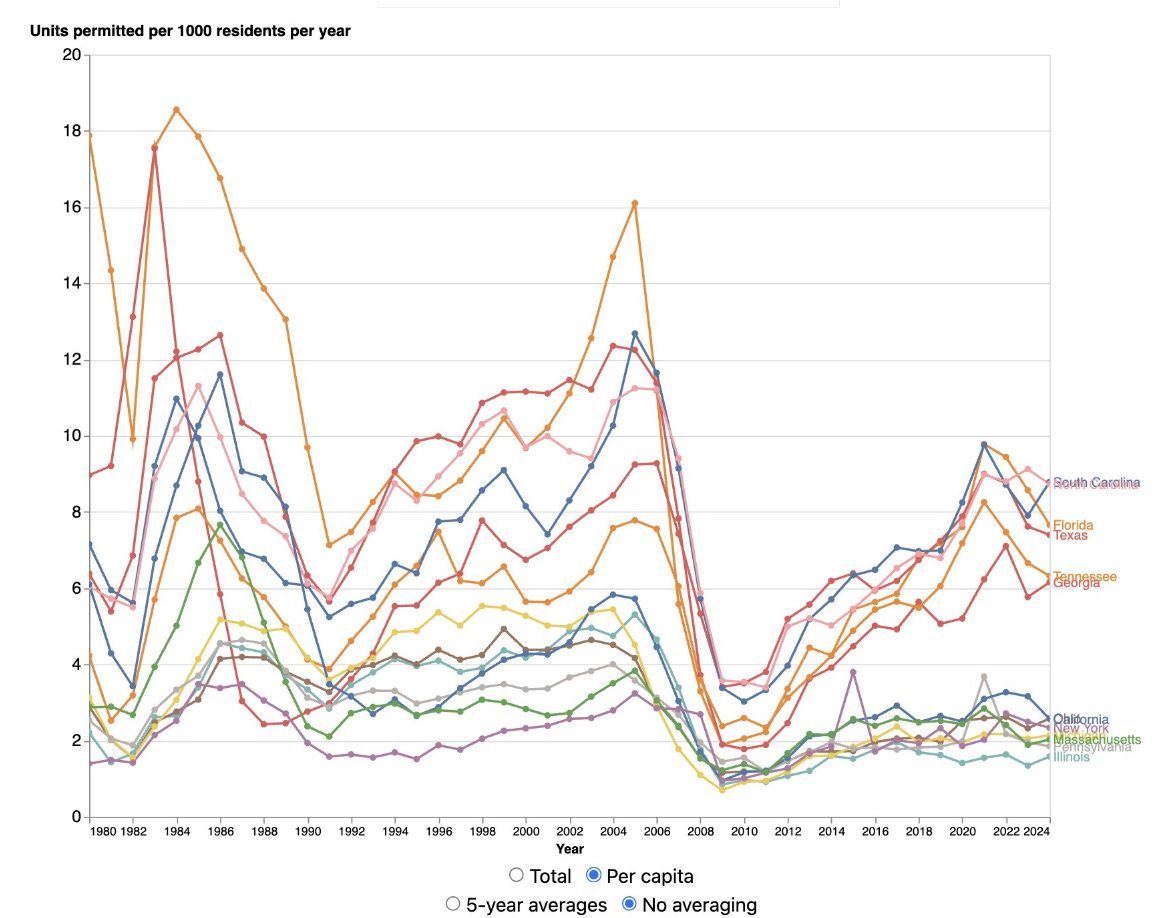
This graph — housing units permitted per 1,000 residents per year in the US, shared by Abundance-champion Derek Thompson earlier this week — is pretty straightforward: “Blue states don’t build. Red states do.”
As for ascertaining why the bifurcation became so pronounced in the wake of the GFC, empirical work shows that the split maps to supply-elasticity and regulatory hurdles:
Metros with stricter land-use rules (WRLURI; Gyourko-Saiz-Summers 2008) and hard geographic constraints (Saiz 2010) convert demand shocks into prices, not permits, while Sun Belt states with flexible zoning and abundant buildable land add units.
After the GFC, tighter credit and the collapse of small-builder financing dampened construction everywhere, but places with by-right approvals and lower fees recovered permitting faster; in constrained coastal “blue” markets, discretionary review (e.g., CEQA-style processes) kept supply muted and prices elevated.
Consistent with Ganong & Shoag (2017) and Hsieh & Moretti (2019), migration then tilted toward low-regulation states, reinforcing their higher permits-per-capita.
Agenda for the Upcoming Week
Upzoning + by-right — Legalize more homes per lot (ADUs/duplexes to mid-rise) and make code-compliant projects automatically approvable without discretionary hearings.
Permit shot clocks + fee cuts — Set statutory deadlines for reviews/approvals and reduce or cap impact/permit/parking fees and similar cost-driving mandates.
Land-value tax reform — Shift taxation toward land (LVT/split-rate) and away from buildings, discouraging speculation/underuse while not penalizing adding units.
State preemption of local bans — State law overrides local rules that block housing (e.g., apartment bans, large minimum lot sizes, parking minimums), setting a statewide baseline that allows more homes.


Appreciate the data rollup. Lots of interesting PoVs.
I voted LVT in the poll because I think a lot of the smaller reforms are downstream of more "aligned" incentives in the housing market.